Loading...

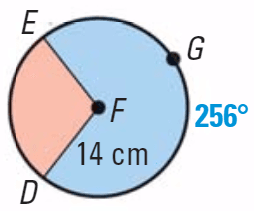
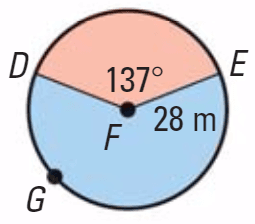
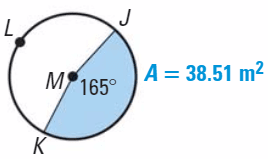
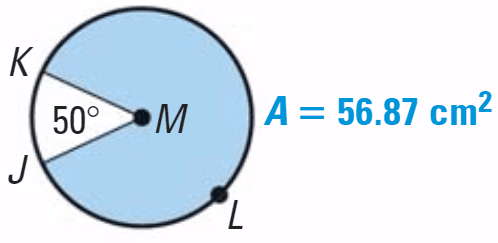
11.5 - Area of Circles and Sectors
QuizĀ by Phillip Adams
Customize this quiz to suit your class
Instantly translate to 100+ languages
Tag the questions with any skills you have. Your dashboard will track each student's mastery of each skill.
Give this quiz to my class


A solution is composed of a solute dissolved in a solvent. In the sugar water described in Figure 5-1, the solute was sugar and the solvent was water, and the solute molecules diffused through the solvent. It is also possible for solvent molecules to diffuse. In the case of cells, the solutes are organic and inorganic compounds, and the solvent is water. The process by which water molecules diffuse across a cell membrane from an area of higher concentration to an area of lower concentration is called osmosis (ahs-MOH-sis). Because water is moving from a higher to lower concentration, osmosis does not require cells to expend energy. Therefore, osmosis is the passive transport of water. Direction of Osmosis The net direction of osmosis depends on the relative concentra- tion of solutes on the two sides of the membrane. Examine Table 5-1. When the concentration of solute molecules outside the cell is lower than the concentration in the cytosol, the solution outside is hypotonic to the cytosol. In this situation, water diffuses into the cell until equilibrium is established. When the concentration of solute molecules outside the cell is higher than the concentration in the cytosol, the solution outside is hypertonic to the cytosol. In this situation, water diffuses out of the cell until equilibrium is established. Observing Diffusion Materials 600 mL beaker, 25 cm dialysis tubing, funnel, 15 mL starch solution (10 percent), 20 drops Lugolās solution, 300 mL water, 100 mL graduated cylinder, 20 cm piece of string (2) Procedure 1. Put on your disposable gloves, lab apron, and safety goggles. 2. Pour 300 mL of water in the 600 mL beaker. 3. Add 20 drops of Lugolās solution to the water. CAUTION: Lugolās solution is a poison and eye and skin irritant. 4. Open the dialysis tubing, and tie one end tightly with a piece of string. 5. Using the funnel, pour 15 mL of 10 percent starch solution into the dialysis tubing. 6. Tie the other end of the dialysis tubing tightly with the second piece of string, forming a sealed bag around the starch solution. 7. Place the bag into the solution in the beaker, and observe the setup for a color change. Analysis What happened to the color in the bag? What happened to the color of the water around the bag? Explain your observations. Quick Lab www.scilinks.org Topic: Osmosis Keyword: HM61090 mb06se_homs01.qxd 11/27/07 8:52 AM Page 98 HOMEOSTASIS AND CELL TRANSPORT 99 When the concentrations of solutes outside and inside the cell are equal, the outside solution is said to be isotonic to the cytosol. Under these conditions, water diffuses into and out of the cell at equal rates, so there is no net movement of water. Notice that the prefixes hypo-, hyper-, and iso- refer to the relative solute concentrations of two solutions. Thus, if the solution outside the cell is hypotonic to the cytosol, then the cytosol must be hyper- tonic to that solution. Conversely, if the solution outside is hypertonic to the cytosol, then the cytosol must be hypotonic to the solution. Water tends to diffuse from hypo- tonic solutions to hypertonic solutions. How Cells Deal with Osmosis Cells that are exposed to an isotonic external environment usually have no difficulty keeping the movement of water across the cell membrane in balance. This is the case with the cells of ver- tebrate animals on land and of most other organ- isms living in the sea. In contrast, many cells function in a hypotonic environment. Such is the case for unicellular freshwater organisms. Water constantly diffuses into these organisms. Because they require a relatively lower concentration of water in the cytosol to function normally, unicel- lular organisms must rid themselves of the excess water that enters by osmosis. Some of them, such as the paramecia shown in Figure 5-2, do this with contractile vacuoles (kon-TRAK-til VAK-y Ģ Ģo Ģ Ģo-OL), which are organelles that remove water. Contractile vacuoles collect the excess water and then contract, pumping the water out of the cell. Unlike diffusion and osmosis, this pumping action is not a form of passive trans- port because it requires the cell to expend energy. Copyright Ā© by Holt, Rinehart and Winston. All rights reserved. (a) (b) Vacuole filling with water Vacuole contracting TABLE 5-1 Direction of Osmosis Condition External solution is hypotonic to cytosol External solution is hypertonic to cytosol External solution is isotonic to cytosol Net movement of water into the cell out of the cell none H2O H2O H2O H2O H2O H2O The paramecia shown below live in fresh water, which is hypotonic to their cytosol. (a) Contractile vacuoles collect excess water that moves by osmosis into the cytosol. (b) The vacuoles then contract, returning the water to the outside of the cell. (LM 315) FIGURE 5-2 100 CHAPTER 5 (a) HYPOTONIC Cell walls (b) HYPERTONIC (a) ISOTONIC (b) HYPOTONIC (c) HYPERTONIC Other cells, including many of those in multicellular organisms, respond to hypotonic environments by pumping solutes out of the cytosol. This lowers the solute concentration in the cytosol, bring- ing it closer to the solute concentration in the environment. As a result, water molecules are less likely to diffuse into the cell. Most plant cells, like animal cells, live in a hypotonic environ- ment. In fact, the cells that make up plant roots may be surrounded by water. This water moves into plant cells by osmosis. These cells swell as they fill with water until the cell membrane is pressed against the inside of the cell wall, as Figure 5-3a shows. The cell wall is strong enough to resist the pressure exerted by the water inside the expanding cell. The pressure that water molecules exert against the cell wall is called turgor pressure (TER-GOR PRESH-er). In a hypertonic environment, water leaves the cells through osmosis. As shown in Figure 5-3b, the cells shrink away from the cell walls, and turgor pressure is lost. This condition is called plasmolysis (plaz-MAHL-uh-sis), and is the reason that plants wilt if they donāt receive enough water. Some cells cannot compensate for changes in the solute con-
Generate all of these 25 questions Part A: Each correct answer is worth 5. 1. The regular pentagon shown has a side length of 2 cm. The perimeter of the pentagon is (A) 2 cm (B) 4 cm (C) 6 cm (D) 8 cm (E) 10 cm 2 cm 2. The faces of a cube are labelled with 1, 2, 3, 4, 5, and 6 dots. Three of the faces are shown. What is the total number of dots on the other three faces? (A) 6 (B) 8 (C) 10 (D) 12 (E) 15 3. The equation that best represents \a number increased by _ve equals 15" is (A) n ō 5 = 15 (B) n _ 5 = 15 (C) n + 5 = 15 (D) n + 15 = 5 (E) n _ 5 = 15 4. The line graph shows the number of bobbleheads sold at a store each year. The sale of bobbleheads increased the most between (A) 2016 and 2017 (B) 2017 and 2018 (C) 2018 and 2019 (D) 2019 and 2020 (E) 2020 and 2021 Number of 2016 2017 2018 2019 2020 Year Sale of Bobbleheads 2021 Bobbleheads 20 40 60 80 5. Starting at 72, Aryana counts down by 11s: 72; 61; 50; : : : . What is the last number greater than 0 that Aryana will count? (A) 4 (B) 5 (C) 6 (D) 7 (E) 8 6. In the diagram, \ABC = 90_. The value of x is (A) 68 (B) 23 (C) 56 (D) 28 (E) 26 Day of the Week 44° x° A B C x° 7. Which of the following values is closest to zero? (A) ō1 (B) 5 4 (C) 12 (D) ō4 5 (E) 0:9 Grade 8 8. A jar contains 267 quarters. One quarter is worth $0.25. How many quarters must be added to the jar so that the total value of the quarters is $100.00? (A) 33 (B) 53 (C) 103 (D) 133 (E) 153 9. A package of 8 greeting cards comes with 10 envelopes. Kirra has 7 cards but no envelopes. What is the smallest number of packages that Kirra needs to buy to have more envelopes than cards? (A) 3 (B) 4 (C) 5 (D) 6 (E) 7 10. For the points in the diagram, which statement is true? (A) e > c (B) b < d (C) f > b (D) a < e (E) a > c y x (e, f ) (a, b) (c, d ) Part B: Each correct answer is worth 6. 11. The 26 letters of the English alphabet are listed in an in_nite, repeating loop: ABCDEFGHIJKLMNOPQRSTUVWXY ZABC : : : What is the 258th letter in this sequence? (A) V (B) W (C) X (D) Y (E) Z 12. A public holiday is always celebrated on the third Wednesday of a certain month. In that month, the holiday cannot occur on which of the following days? (A) 16th (B) 22nd (C) 18th (D) 19th (E) 21st 13. A circular spinner is divided into three sections. An arrow is attached to the centre of the spinner. The arrow is spun once. The probability that the arrow stops on the largest section is 50%. The probability it stops on the next largest section is 1 in 3. The probability it stops on the smallest section is (A) 1 4 (B) 2 5 (C) 1 6 (D) 2 7 (E) 3 10 14. A positive number is divisible by both 3 and 4. The tens digit is greater than the ones digit. How many positive two-digit numbers have this property? (A) 4 (B) 5 (C) 6 (D) 7 (E) 8 15. A rectangular pool measures 20 m by 8 m. There is a 1 m wide walkway around the outside of the pool, as shown by the shaded region. The area of the walkway is (A) 56 m2 (B) 60 m2 (C) 29 m2 (D) 52 m2 (E) 50 m2 20 m 8 m 1 m Grade 8 16. The results of asking 50 students if they participate in music or sports are shown in the Venn diagram. What percentage of the 50 students do not participate in music and do not participate in sports? (A) 0% (B) 80% (C) 20% (D) 70% (E) 40% Music Sports 15 5 20 17. There are 2 3 as many golf balls in Bin F as in Bin G. If there are a total of 150 golf balls, how many fewer golf balls are in Bin F than in Bin G? (A) 15 (B) 30 (C) 50 (D) 60 (E) 90 18. In the sequence shown, Figure 1 is formed using 7 squares. Each _gure after Figure 1 has 5 more squares than the previous _gure. What _gure has 2022 squares? (A) Figure 400 (B) Figure 402 (C) Figure 404 (D) Figure 406 (E) Figure 408 Figure 1 Figure 2 Figure 3 19. Mateo's 300 km trip from Edmonton to Calgary passed through Red Deer. Mateo started in Edmonton at 7 a.m. and drove until stopping for a 40 minute break in Red Deer. Mateo arrived in Calgary at 11 a.m. Not including the break, what was his average speed for the trip? (A) 83 km/h (B) 94 km/h (C) 90 km/h (D) 95 km/h (E) 64 km/h 20. Equilateral triangle ABC has sides of length 4. The midpoint of BC is D, and the midpoint of AD is E. The value of EC2 is (A) 7 (B) 6 (C) 6:25 (D) 8 (E) 10 Part C: Each correct answer is worth 8. 21. The positive factors of 6 are 1, 2, 3, and 6. There are two perfect squares less than 100 that have exactly _ve positive factors. What is the sum of these two perfect squares? (A) 177 (B) 80 (C) 145 (D) 52 (E) 97 22. In the list p; q; r; s; t; u; v, each letter represents a positive integer. The sum of the values of each group of three consecutive letters in the list is 35. If q + u = 15, then p + q + r + s + t + u + v is (A) 85 (B) 70 (C) 80 (D) 90 (E) 75 Grade 8 23. The net shown is folded to form a cube. An ant walks from face to face on the cube, visiting each face exactly once. For example, ABCFED and ABCEFD are two possible orders of faces the ant visits. If the ant starts at A, how many possible orders are there? (A) 24 (B) 48 (C) 32 (D) 30 (E) 40 A D B C E F 24. The number 385 is an example of a three-digit number for which one of the digits is the sum of the other two digits. How many numbers between 100 and 999 have this property? (A) 144 (B) 126 (C) 108 (D) 234 (E) 64 25. Student A, Student B, and Student C have been hired to help scientists develop a new avour of juice. There are 4200 samples to test. Each sample either contains blueberry or does not. Each student is asked to taste each sample and report whether or not they think it contains blueberry. Student A reports correctly on exactly 90% of the samples containing blueberry and reports correctly on exactly 88% of the samples that do not contain blueberry. The results for all three students are shown below. Student A Student B Student C Percentage correct on samples 90% 98% (2m)% containing blueberry Percentage correct on samples 88% 86% (4m)% not containing blueberry Student B reports 315 more samples as containing blueberry than Student A. For some positive integers m, the total number of samples that the three students report as containing blueberry is equal to a multiple of 5 between 8000 and 9000. The sum of all such values of m is (A) 45 (B) 36 (C) 24 (D) 27 (E) 29
THE STRATEGIC PLAN OF RICHARD BLAND COLLEGE OF WILLIAM & MARY 2020-2025 āThe dogmas of the quiet past are inadequate to the stormy present. The occasion is piled high with difficulty, and we must rise with the occasion. As our case is new, so we must think anew and act anew.ā ā Abraham Lincoln What is the role of a selective, two-year, residential, liberal arts transfer institution within the higher education landscape of the Commonwealth of Virginia? This is a key question that must be answered to ensure the success of Richard Bland College (RBC) and the constituency that the College serves. The 2020 RBC strategic planās primary objective is to answer that very question so that the College, the community and the Commonwealth can engage successfully within this identity and purpose to the benefit of all. RBC has long been identified as the hidden gem of higher education in Virginia. The hidden adjective is based both on its relative obscurityāfew are aware of RBC outside the Tri-Cities regionāand its rural setting featuring 750+ acres of wetlands, bucolic forest, and the stateās oldest and largest pecan grove. Additionally, on average, a student of Richard Bland College travels a mere 36 miles to campus. This keeps the knowledge of RBC in a tightly focused radius. The gem moniker refers both to the Collegeās reputation for excellence and the undeniable sensation that the campus often elicits in its students, visitors, faculty and staff, the feeling of a warm and palpable embrace of care, compassion and support. That sensation is where we start. According the State Council of Higher Education for Virginia (SCHEV), 99% of the 11.5 million new jobs created since the great recession require workers to have more than a high-school education. Students with a bachelorās degree have an earning potential almost double that of people with only a high school education, and yet only 17% of residents in the Petersburg area have a bachelorās degree, 15% below the national average. The obstacles in the way of education have been exhaustively researched and include financial challenges, academic under-preparedness, low self-esteem, slow college assimilation and immature levels of self-efficacy. To combat this growing problem, Richard Bland College initiated a pilot program to determine the viability of a data-driven approach to improve retention and graduation rates. The program ultimately effected a cultural, organizational and operational shift at RBC, resulting in a personalized model of student support, the Exceptional Student Experience (ESE@RBC). Originally many of the practices that RBC used as the basis of ESE@RBC were adapted from the four key principles found in the American Association of Community Colleges (AACC) Pathways Project: 1) map pathways to student end goals; 2) help students choose and enter a program pathway; 3) keep students on path; and 4) ensure that students are learning. Unfortunately, limited resources made it necessary to skip some primary elements of guided pathways and instead to focus on a specific, high-priority project that was immediately available for implementation, dedicated student support. This strategic framework reimagines the way that RBC serves students, faculty and staff within the context of our existing culture, the principles of guided pathways and a hybrid work-college experience. Rather than thinking of a two-year college as a pipeline to a four-year university, this vision describes a more expansive menu of well-defined pathways to high-demand fields, all radiating from a curriculum constructed around the development of soft skills that define the liberal arts experience: critical thinking, written communication, analytical reasoning, civic engagement and oral communication. Furthermore, the impact of meaningful work is a resonating theme, providing avenues to participate in career-focused internships and jobs that develop important life & work skills, confidence, and character. Richard Bland has tested its entrepreneurial mettle and its capacity for transformation in recent years. The College was among a select few Competency-Based Education sites established by the U.S. Department of Education. We were ahead of the curve using predictive analytics to improve student retention and success rates, and online enrollment now makes up nearly 20 percent of course offerings. It may be counter-intuitive, but these and other deep-level institutional changes still to come will ensure that Richard Bland College remains true to its original mission. We prepare our students for a lifetime of endless potential.
In many cases, cells must move materials from an area of lower concentration to an area of higher concentration, or āupā their concentration gradient. Such movement of materials is known as active transport. Unlike passive transport, active transport requires a cell to expend energy. CELL MEMBRANE PUMPS Ion channels and carrier proteins not only assist in passive trans- port but also help with some types of active transport. The car- rier proteins that serve in active transport are often called cell membrane āpumpsā because they move substances from lower to higher concentrations. Carrier proteins involved in facilitated diffusion and those involved in active transport are very similar. In both, the molecule first binds to a specific kind of carrier protein on one side of the cell membrane. Once it is bound to the molecule, the protein changes shape, shielding the molecule from the hydrophobic interior of the phospholipid bilayer. The protein then transports the molecule through the membrane and releases it on the other side. However, cell membrane pumps require energy. Most often the energy needed for active transport is supplied directly or indirectly by ATP. Sodium-Potassium Pump One example of active transport in animal cells involves a carrier protein known as the sodium-potassium pump. As its name sug- gests, this protein transports Na ions and K ions up their con- centration gradients. To function normally, some animal cells must have a higher concentration of Na ions outside the cell and a higher concentration of K ions inside the cell. The sodium- potassium pump maintains these concentration differences. Follow the steps in Figure 5-6 on the next page to see how the sodium-potassium pump operates. First, three Na ions bind to the carrier protein on the cytosol side of the membrane, as shown in step . At the same time, the carrier protein removes a phosphate group from a molecule of ATP. As you can see in step , the phos- phate group from the ATP molecule binds to the carrier protein. Step shows how the removal of the phosphate group from ATP supplies the energy needed to change the shape of the carrier pro- tein. With its new shape, the protein carries the three Na ions through the membrane and then forces the Na ions outside the cell where the Na concentration must remain high. 3 2 1 SECTION 2 OBJECTIVES ā Distinguish between passive transport and active transport. ā Explain how the sodium-potassium pump operates. ā Compare endocytosis and exocytosis. VOCABULARY active transport sodium-potassium pump endocytosis vesicle pinocytosis phagocytosis phagocyte exocytosis www.scilinks.org Topic: Active Transport Keyword: HM60018 mb06se_homs02.qxd 5/18/07 11:02 AM Page 103 104 CHAPTER 5 K+ K+ K+ K+ K+ K+ INSIDE OF CELL OUTSIDE OF CELL Carrier protein Cell membrane P P P P Na+ Na+ Na+ ATP ADP Na+ Na+ Na+ Na+ Na+ Na+ 1 2 3 4 5 6 At this point, the carrier protein has the shape it needs to bind two K ions outside the cell, as step shows. When the K ions bind, the phosphate group is released, as indicated in step , and the carrier protein restores its original shape. As shown in step this time, the change in shape causes the carrier protein to release the two K ions inside the cell. At this point the carrier protein is ready to begin the process again. Thus, a complete cycle of the sodium-potassium pump transports three Na ions out of the cell and two K ions into the cell. At top speed, the sodium-potassium pump can transport about 450 Na ions and 300 K ions per second. The exchange of three Na ions for two K ions creates an electrical gradient across the cell membrane. That is, the outside of the membrane becomes positively charged relative to the inside of the membrane, which becomes relatively negative. In this way, the two sides of the cell membrane are like the positive and nega- tive terminals of a battery. This difference in charge is important for the conduction of electrical impulses along nerve cells. The sodium-potassium pump is only one example of a cell membrane pump. Other pumps work in similar ways to transport important metabolic materials across cell membranes.
Q1. A teacher designs a lesson where students compute real-life percentages such as discounts and savings. š A student calculates 15% of 200 to determine savings in a purchase. What is the correct result? A. 20 B. 25 C. 30 D. 35 Q2. In a classroom activity, learners compare numbers to find the highest common factor for grouping materials evenly. š What is the GCF of 24 and 36? A. 6 B. 8 C. 12 D. 18 š FRACTIONS, DECIMALS, AND POWERS Q3. A learner converts fractions into percentages for data interpretation. š What is 3/4 expressed as a percentage? A. 50% B. 60% C. 75% D. 80% Q4. A student models exponential growth using repeated multiplication. š What is the value of 252^525? A. 25 B. 30 C. 32 D. 64 š ALGEBRA (EQUATIONS AND EXPRESSIONS) Q5. A teacher guides students to solve equations that represent real-life situations. š Solve: 2x+8=202x + 8 = 202x+8=20 A. x = 4 B. x = 6 C. x = 8 D. x = 10 Q6. Students simplify expressions to understand relationships between quantities. š Simplify: 3(x+4)ā2x3(x + 4) - 2x3(x+4)ā2x A. x + 12 B. x + 4 C. 5x + 4 D. 5x + 12 š FUNCTIONS AND GRAPHING Q7. A student analyzes a linear equation to determine its rate of change. š What is the slope of y=3xā5y = 3x - 5y=3xā5? A. -5 B. -3 C. 3 D. 5 Q8. A learner evaluates functions to predict outcomes. š If f(x)=2x+3f(x) = 2x + 3f(x)=2x+3, what is f(4)f(4)f(4)? A. 7 B. 9 C. 11 D. 14 š GEOMETRY Q9. Students explore geometric shapes and their properties through visual models. š What is the sum of interior angles of a triangle? A. 90° B. 180° C. 270° D. 360° Q10. A student calculates the area of a classroom table with dimensions 8 cm by 5 cm. š What is the area? A. 26 sq cm B. 30 sq cm C. 40 sq cm D. 48 sq cm š MEASUREMENT AND FIGURES Q11. A learner determines the volume of a cube used in a science experiment. š What is the volume of a cube with side 4 cm? A. 16 cubic cm B. 32 cubic cm C. 48 cubic cm D. 64 cubic cm Q12. Students identify shapes used in design projects. š How many sides does a hexagon have? A. 5 B. 6 C. 7 D. 8 š STATISTICS AND PROBABILITY Q13. A teacher helps students interpret data sets using measures of central tendency. š What is the mean of 4, 6, 8, 10, 12? A. 6 B. 8 C. 10 D. 12 Q14. A class experiment involves flipping a fair coin. š What is the probability of getting heads? A. 1/4 B. 1/3 C. 1/2 D. 2/3 š WORD PROBLEMS (APPLICATION) Q15. A car travels 180 km in 3 hours during a learning task on speed. š What is its average speed? A. 45 km/h B. 60 km/h C. 75 km/h D. 90 km/h Q16. Students analyze work efficiency in a project. š If 5 workers complete a task in 12 days, how long will 10 workers take? A. 3 days B. 6 days C. 8 days D. 12 days Q17. A student solves a problem involving ratios in a classroom population. š If the ratio of boys to girls is 3:2 and there are 30 students, how many boys are there? A. 12 B. 15 C. 18 D. 20 Q18. A learner determines the duration of a scheduled trip. š A journey starts at 8:30 AM and ends at 11:15 AM. How long is the trip? A. 2 hrs 15 mins B. 2 hrs 30 mins C. 2 hrs 45 mins D. 3 hrs 15 mins Q19. A student computes simple interest for financial literacy. š What is the simple interest on ā±1000 at 5% for 2 years? A. ā±50 B. ā±75 C. ā±100 D. ā±150 Q20. A learner solves a perimeter problem involving a rectangle. š A rectangle has a length of 12 cm and perimeter of 34 cm. What is the width? A. 5 cm B. 7 cm C. 10 cm D. 11 cm ā
ANSWER KEY (BASED ON YOUR REVIEWER) (All verified from your uploaded file) [ilide.info...002acd4e5a | PDF] QAnswer1C2C3C4C5B6A7C8C9B10C11D12B13B14C15B16B17C18C19C20A
Make a multiple choice quiz for my year 8 science students based on the science in this transcript from a video: 3°C 0:04 It can be the difference between snow and sleet 0:08 Wearing a jacket or not 0:11 In your day-to-day life, it may not seem significant 0:15 But 3°C of global warming would be catastrophic 0:20 Heatwaves, droughts, extreme precipitation, even fire 0:25 3°C of warming is really disastrous 0:28 The scary thing is, the world is well on its way there 0:32 Since the industrial revolution, the Earth has warmed between 1.1°C and 1.3°C 0:40 This is a problem that babies you pass in the street will have to live with 0:46 Children born today... 0:47 ...are up to seven times more likely to face extreme weather than their grandparents 0:52 If global temperatures do rise by 3°C... 0:55 ...what would their world look like? Climate change is already having devastating effects 1:03 Rising sea levels 1:05 Desertification 1:07 Hollywood has always enjoyed imagining the end of the world 1:11 While blockbusters like this are clearly fiction... 1:14 ...this film will show the scenario we all face... 1:17 ...unless more drastic measures are taken to stop burning fossil fuels 1:30 In some parts of the world the effects of inaction are already clear 1:35 The slums of Bangladeshās capital are filling up with climate migrants 1:41 Minara comes from Bhola District, an area in southern Bangladesh 1:46 There, like many other parts of the country... 1:49 ...rivers swollen by heavier rain and melting Himalayan glaciers... 1:53 ...are washing away peopleās homes 1:56 Many, like her, have lost everything 2:00 Our home in Bhola had endless amounts of land 2:03 There was lots of space for farming, we had a spacious house 2:08 There were different types of fruits, vegetation and trees growing at home 2:12 We used to eat the fruit from our own trees 2:18 I canāt eat them now because they don't exist anymore 2:21 Since the river flooded for the third time, I had to flee to Dhaka 2:26 Life was much better back home 2:29 It was unbearable to live through, truly intolerable 2:33 We didnāt have the time to save anything at all 2:38 1.1°C to 1.3°C of global warming has already transformed Minaraās life 2:45 Itās one of the reasons why so many migrants like her... 2:47 ...are moving to the city each year... 2:50 ...nearly 400,000 according to the last estimate 2:53 And climate models show there could be much worse to come How climate modelling works 3:02 Climate scientist Joeri Rogelj... 3:04 ...has spent the last ten years modelling future climate scenarios... 3:08 ...for the United Nations 3:10 The models we use to carry out this exercise... 3:13 ...really represent the state of the art... 3:15 ...of our current knowledge of climate change and where we are heading 3:19 Joeriās projections use data collected by hundreds of scientists around the world 3:26 Here this is the 3°C level... 3:28 ...and so there is at least a one-in-four chance that under current policies... 3:32 ...we would hit 3°C by the end of the century 3:36 This is just one of the scenarios Joeri looks at 3:40 Another one imagines that all policy promises are kept 3:44 The most optimistic assumes that all promises have been kept... 3:47 ...and net-zero targets are met 3:50 Where our best estimate ends up around 2°C at the end of the century... 3:54 ...there is still a one-in-20 chance that we end up with 3°C instead 3:59 One would not be entering a plane if there is a one-in-20 chance... 4:03 ...that the plane will crash Nowhere is safe from global warming 4:07 A rise of 3°C would affect everyone 4:10 Even wealthy cities in rich countries wouldnāt be immune to the consequences 4:15 European capitals like Paris and Berlin... 4:18 ...would bake under more extreme heatwaves 4:22 Frequent storm-surges in New York could turn parts of the city desolate 4:27 In many ways, cities magnify, intensify climate events 4:33 Cities are hotter than the places around them... 4:36 ...they tend to be more vulnerable to flooding 4:39 And you can get a really bad event in a city in a way that you canāt in the countryside 4:46 And because of their denser populations... 4:49 ...disasters in a city affect far more people 4:52 Some cities might be badly prepared for the changes coming 4:56 But they have the means to adapt 4:59 Cities tend to be wealthier than surrounding places 5:03 They have a lot of amenities 5:05 A city that has taken seriously the risks of a 3°C world... 5:08 ā¦wouldnāt necessarily be a worse place to be in a 3°C world 5:12 But a city that hasnāt prepared for these sort of eventualities... 5:16 ...that might be a really nasty place The impact of prolonged droughts 5:20 So far, many developed cities have got off lightly... 5:24 ...but some rural parts of the world are suffering disproportionately 5:29 Smallholdersāsmall-scale farmersāare particularly vulnerable to climate change 5:35 And there are over 600 million around the world 5:38 Smallholders with farms under two hectares... 5:40 ...produce around a third of the global food supply 5:46 Central Americaās āDry Corridorā... 5:48 ...supports a mix of smallholdings and medium-sized farms 5:53 Sandwiched between the Pacific Ocean and the Caribbean Sea... 5:56 ...the area is prone to droughts 6:08 Israel RamĆrez Rivera is a smallholder in Guatemala 6:12 Here, climate change is making the dry seasons longer, and more severe 6:18 This is the biggest ear of maize that this plot could deliver 6:23 He depends on his crops of corn and beans 6:26 But theyāre getting harder to grow 6:30 The surrounding mountains... 6:32 ...used to provide us with native food... 6:38 ...and now that isnāt an option anymore... 6:41 ...due to climate change and its effects 6:46 Nearly two-thirds of the smallholders in the Dry Corridor now live in poverty 6:52 The impact of all of this for us... 6:59 ...malnutrition among children 7:03 Weāve lost a few 7:07 For my crops especially, the midsummer heat is harder than before 7:16 The plant dries up and canāt provide us... 7:19 ...with the necessary food provision 7:24 Severe droughts in Central America... 7:26 ...are now four times more likely than they were last century 7:30 Many families from here have gone to the States 7:37 The economic despair and debts... 7:44 ...have pushed many people from this community to do this journey 7:53 Migration from Guatemala to the United States has quadrupled since 1990 7:59 Not all of this has been due to climate change 8:02 But longer droughts would force even more to move 8:05 In a 3°C world, annual rainfall in this region... 8:09 ...could drop by up to 14% 8:12 At 3°C, over a quarter of the worldās population... 8:16 ...could endure extreme droughts for at least a month of the year 8:19 Northern Africa could see droughts that last for years at a time Rising sea levels, storm surges and flooding 8:24 But for some, too much water will be the problem 8:29 10% of the worldās population lives on a coastline... 8:32 ...thatās less than 10 metres above sea level 8:35 For these coastal inhabitants, a 3°C world would spell disaster 8:40 By 2100, global sea levels could have climbed by half a metre from 2005 levels 8:46 Low-lying cities like Lagos would be especially vulnerable... 8:49 ...with up to up to a third of the population displaced 8:54 And in Fiji, rising waters are already upending lives 9:04 You can see the graveyard there, itās all under water now... 9:08 ...due to this rising sea level and climate change 9:15 The village of Togoru in Fiji is being swallowed by the sea 9:19 Barney Dunn, the village headman, has seen over half the village disappear 9:24 Relativesā houses have been abandoned, and family graves are now under water 9:29 We have been asked by the government to relocate... 9:32 ...but no one wants to relocate... 9:34 ...because we have our great-great-grandparents down there in the sea 9:39 This is the place weāve been brought up in 9:41 ...itās not easy to leave 9:44 Past attempts to build a seawall havenāt worked 9:48 But Barney sees building a new one as the villageās only hope 9:52 If they do that, maybe we can save whatever is left 9:56 But if we donāt have the seawall, then it will be keep eroding and time will come... 10:01 ...maybe in ten,15 years, Togoru will be all eroded 10:05 Rising seas also mean storms cause more floods 10:11 And many more countries could suffer 10:14 The Philippines and Myanmar are just two countries... 10:17 ...that will also see an increase in storm surges in a 3°C world 10:21 To escape, many will move⦠10:24 ā¦often, to urban areas Extreme heat and wet-bulb temperatures 10:27 Half the worldās population already lives in cities... 10:31 ...almost a third in slums 10:36 For them, a 3°C world could be deadly 10:40 Minara has moved to Dhaka to escape the impact of climate change 10:44 But life could get even worse for her 10:47 Iām struggling a lot nowadays 10:49 The heat during the day is unbearable 10:52 Even late at night it doesnāt cool down 10:57 The heat is getting more intense every day 10:59 I mean, itās going to get much worse 11:03 I can barely survive it now, how will I live through it in the future? 11:08 Dhaka is getting hotter 11:11 In the last 20 years the average daytime temperature... 11:13 ...has crept up by nearly half a degree 11:17 Days that approach 40°C are now being reported 11:20 And high so-called wet-bulb temperatures are on the rise 11:26 A wet-bulb temperature is a measure of heat and humidity 11:30 Humans cool themselves by sweating⦠11:32 But in these conditions, when relative humidity is near 100%... 11:36 ...sweat doesnāt evaporate well 11:38 So people canāt cool down⦠11:41 ...even if given unlimited shade and water 11:45 At a high wet-bulb temperature, the body canāt lose heat... 11:49 ...and so it gets hotter and hotter... 11:51 ...and the body is designed to work at a given temperature 11:53 And if it gets too hot inside, you will die 11:58 The human limit for wet-bulb temperatures is 35°C... 12:02 ...around skin temperature 12:04 Dhaka will have a much higher chance... 12:05 ...of reaching dangerous wet-bulb temperatures... 12:07 ...if global warming reaches 3°C 12:12 You canāt really adapt to that 12:14 You have to get out. If the temperature is so high that you canāt work... 12:20 ...canāt do hard manual labour outside for significant parts of the year... 12:25 ...then many places will become functionally no longer part of the economy 12:33 Jacobabad in Pakistan, and Ras al Khaimah, in the United Arab Emirates... 12:37 ...have already recorded deadly wet-bulb temperatures 12:40 More of the tropics and the Persian Gulf... 12:43 ...as well as parts of Mexico and the south-eastern United States... 12:47 ...could all get to this threshold by the end of the century 12:50 Climate modelling might show us the weather Increased migration and conflict 12:52 But it doesnāt show us its other effects on society 12:56 Established migration patterns could change 12:59 Climate disasters may exacerbate reasons people cross borders 13:03 Within countries, more people will move to cities 13:07 In a 3°C world, tens of millions of people a year... 13:10 ...could be displaced by disasters made worse by climate change 13:15 When people are displaced by climate... 13:18 ā¦they may well go to cities... 13:19 ...because cities are the places that attract people from the countryside already 13:25 A lot of people who can get to the developed world... 13:28 ...not least because the developed world tends to be less hot, will give that a go 13:35 As migration around the world increases... 13:38 ...there could be more competition for fewer resources 13:42 Waterāalready a highly contested resourceāwill be a focal point 13:47 Turkeyās new Ilisu dam has reduced the flow of water into Iraq 13:53 China lays claim to rivers vital to India and Pakistan 13:57 The prospect of a water-conflict makes people very uneasy 14:03 How national tensions would exacerbate those sorts of reactions... 14:08 ...in a 3°C world... 14:09 ...is the sort of thing that no one should really want to find out 14:14 I think youād have to be incredibly sanguine... 14:16 ...not to think that the sort of climate extremes that we talk about... 14:19 ...in a 3°C world wouldnāt lead some places... 14:22 ...to the brink of societal collapse 14:25 Those lucky enough to escape unrest... Adaptation and mitigation are crucial 14:28 ...would still have to adapt to a radically different world 14:32 People can adapt to climate change in all sorts of ways, one of the most obvious ones... 14:37 ...is air conditioning 14:39 But other ways to adapt at a local or regional level... 14:42 ...I mean, one of the most obvious is diversifying agriculture 14:47 There are physical things you can do, like seawalls 14:52 The fact that people can adapt and that adaptation will reduce suffering... 14:57 ...doesnāt mean that it will eliminate suffering 15:00 Suffering is built into this whole process of heating up the planet 15:06 Adaptation will only get the world so far 15:09 The best way to deal with a 3°C world... 15:12 ...is not to go to a 3°C world 15:14 And thatās why increasing efforts on mitigation are important 15:17 Itās why working towards negative emissions... 15:20 ...that could bring down the temperature after it peaks are important 15:25 Once you get to a 3°C world, you are in real bad global trouble 15:33 The scale of change needed... 15:35 ...and the slow progress of governments so far... 15:38 ...means 3°C of warming is uncomfortably likely unless more is done 15:44 Despite existing pledges, greenhouse-gas emissions... 15:48 ...are still set to rise by 16% from 2010 levels by 2030 15:54 The need to act has never been clearer 15:57 Thereās still time to reduce emissions, so that a 3°C world remains fiction... 16:02 ...rather than becoming fact
1. What calm area near the Equator is characterized by minimal wind movement? Answer: Doldrums 2. What are visible accumulations of tiny water droplets or ice crystals in the air called? Answer: Clouds 3. Which cloud type is high, thin, and made of ice crystals? Answer: Cirrus 4. What do we call the apparent deflection of winds and currents due to Earthās rotation? Answer: Coriolis effect 5. In which hemisphere do storms rotate clockwise? Answer: Southern Hemisphere 6. What are winds that blow consistently from one direction over a specific area called? Answer: Prevailing winds 7. What is the area where prevailing winds meet called? Answer: Convergence zone 8. Which wind zone blows from the polar regions toward the mid-latitudes? Answer: Polar easterlies 9. In which hemisphere do storms rotate counterclockwise? Answer: Northern Hemisphere 10. Which wind zone blows from west to east across the mid-latitudes? Answer: Westerlies 11. What are the calm areas around 30° north and south latitude with little precipitation called? Answer: Horse latitudes 12. What winds blow toward the Equator from the northeast in the Northern Hemisphere and from the southeast in the Southern Hemisphere? Answer: Trade winds 13. Which cloud type is mid-level and blankets the sky, often bringing overcast weather? Answer: Stratus 14. Which cloud type is puffy and can bring heavy rain or snow depending on height? Answer: Cumulus 15. What prefixes indicate the height of clouds in the atmosphere? Answer: Cirro-, alto-, nimbo-
GUIDELINES ON THE ESTABLISHMENT AND IMPLEMENTATION OF THE RESULTS-BASED PERFORMANCE MANAGEMENT SYSTEM IN THE DEPARTMENT OF EDUCATION I. Rationale 1. The Civil Service Commission (CSC), through the issuance of Memorandum Circular (MC) No. 06, series of 2012, sets the guidelines on the establishment and implementation of the Strategic Performance Management System (SPMS) in all government agencies. The SPMS gives emphasis to the strategic alignment of the agencyās thrusts with the day-to-day operation of the units and individual personnel within the organization. It focuses on measures of performance vis-a-vis the targeted milestones, and provides a credible and verifiable basis for assessing the organizational outcomes and the collective performance of the government employees. 2. As a learner-centered institution, the Department of Education (DepEd) is committed to continuously improve itself to better serve the Filipino learners and the community. The adoption of the SPMS in DepEd strengthens the culture of performance and accountability in the agency, with the DepEdās mandate, vision and mission at its core. 3. There is a need to concretize the linkage between the organizational thrusts and the performance management system. It is important to ensure organizational effectiveness and track individual improvement and efficiency by cascading the institutional accountabilities to the various levels, units and individual personnel, as anchored on the establishment of a rational and factual basis for performance targets and measures. Finally, it is necessary to link the SPMS with other systems relating to human resources and to ensure adherence to the principle of performance-based tenure and incentives. 4. In view of the above, this Order aims to adopt the SPMS as the Results-based Performance Management System (RPMS). II. Scope of Policy 5. This DepEd Order provides for the establishment and implementation of the RPMS in all DepEd schools and offices, covering all officials and employees, school-based and non school-based, in the Department holding regular plantilla positions. It stipulates the specific mechanisms, criteria and processes for the performance target setting, monitoring, evaluation and development planning. IV. Policy Statement 9. The DepEd hereby sets the guidelines on the establishment and implementation of the Results-based Performance Management System (RPMS) in the Department, stipulating the strategies, methods, tools and rewards for assessing the accomplishments vis-a-vis the commitments. This will be used for measuring and rewarding higher levels of performance of the various units and development planning of all personnel in all levels. 10. For non school-based personnel, the RPMS shall provide for an objective and verifiable basis for rating and ranking the performance of units and individual personnel in view of the granting of the Performance-Based Bonus (PBB) starting 2015. 11. For school-based personnel, the RPMS shall be used only as an appraisal tool, which shall be the basis for training and development. The granting of PBB shall be governed by the existing PBB guidelines. 12. The Department shall adopt the RPMS framework shown in Annex B. 13. The DepEd RPMS shall follow the four-stage performance management system cycle as prescribed by the CSC: i. Performance planning and commitment (Phase I); ii. Performance monitoring and coaching (Phase II); iii. Performance review and evaluation (Phase III); and iv. Performance rewarding and development planning (Phase IV). V. Performance Cycle/Process 14. The RPMS shall align the performance targets and accomplishments with the Departmentās mandate, vision, mission and strategic goals. It shall ensure 100% results orientation vis-a-vis the planned targets. On the other hand, the rateeās demonstration of the required competencies shall be monitored for developmental purposes only. 15. The RPMS cycle shall cover performance for one whole year. All school-based personnel shall follow a performance cycle starting in April of the current year and ending in March of the following year; while non school-based personnel shall follow a performance cycle starting in January and ending in December. Annexes C and D illustrate the performance cycles which shall apply to school-based and non school-based personnel, respectively. 16. The performance planning and commitment shall be done prior to the beginning of the performance cycle; while the performance monitoring and coaching shall take place immediately after Phase I, and continue throughout the performance cycle. The performance review and evaluation, as well as the performance rewarding and development planning shall be done at the end of the performance cycle. A. Phase I: Performance Planning and Commitment 17. The performance planning and commitment shall be done prior to the start of the performance cycle where the rater meets with the ratee to discuss and agree on the following: i. Office KRAs, Objectives and Performance Indicators as anchored to the overall organizational outcomes; and ii. Individual KRAs, Objectives and Performance Indicators as anchored to the Office KRAs and Objectives. 18. The Office Performance Commitment and Review Form (OPCRF) shall be accomplished by the head of office to reflect the Office KRAs, Objectives and Performance Indicators. The head of office, in coordination with the Planning Office, shall ensure alignment of the office plans and commitments to the overall organizational outcomes. The OPCRF shall be equivalent to the IPCRF of the head of office. A sample of the filled out OPCRF, including the instructions for accomplishing the form, is shown in Annex E. 19. The Individual Performance Commitment and Review Form (IPCRF) shall be accomplished by the individual personnel to reflect the agreed Individual KRAs, Objectives and Performance Indicators. A sample of the filled out IPCRF, including the instructions for accomplishing the form, is shown in Annex F. 20. Defining the Key Result Areas. The head of office, in coordination with the Planning Office, shall define the office KRAs as anchored on the overall organizational outcomes. The rater and the ratee shall discuss and agree on the break down of the office KRAs into individual KRAs. Three (3) to five (5) KRAs shall be defined for each office and individual employee. KRAs are broad categories of general outputs or outcomes. It is the mandate or function of the office and/or individual employee. The KRA is the reason why an office and/or job exist. It is an area where the office and/or individual employee are expected to focus on. 21. Setting the Objectives. The head of office shall set three (3) objectives per office KRA. The rater and the ratee shall discuss and agree on three (3) objectives per individual KRA. Objectives are specific tasks, which an office and/or employee need to do to achieve their specific KRAs. In objective setting, the SMART criteria, which stands for Specific, Measurable, Attainable, Relevant, Time Bound, shall be applied. The SMART criteria are illustrated in Annex G. 22. Setting the Timeline. The timeline shall define the target date for accomplishing each of the Objectives. The timeline for the office Objectives shall be set by the head of office in coordination with the Planning Office and School Planning Team; while the timeline for the individual Objectives shall be discussed and agreed by the rater and the ratee. 23. Assigning the Weight. Assigning of weights shall be done per KRA. Weights for each office KRA shall be assigned by the head of office in coordination with the Planning Office; while the weights for each of the individual KRAs shall be discussed and agreed upon by the rater and the ratee. 24. Identifying the Performance Indicators. Using a five (5)-point rating scale, the head of office shall identify a performance indicator for each of the office objectives, while the rater and the ratee shall identify and agree on the performance indicator for each of the individual objectives. Performance indicators are exact quantification of objectives expressed through rubrics. They are assessment tools, which gauge whether a performance is positive or negative. In identifying the performance indicator, the operational definition or meaning of each numerical rating shall be indicated under each relevant dimension (i.e., quality, efficiency, or timeliness) per performance target or success indicator. This shall ensure that the rating is objective, impartial and verifiable. Table 1 below discusses the performance measures by which the indicator must satisfy. Table 1. Performance Measures CATEGORY DEFINITION Effectiveness/Quality The extent to which actual performance compares with targeted performance. The degree to which objectives are achieved and the extent to which targeted problems are solved. In management, effectiveness relates to getting the right things done. Efficiency The extent to which time or resources is used for the intended task or purpose. Measures whether targets are accomplished with a minimum amount or quantity of waste, expense, or unnecessary effort. Timeliness Measures whether the deliverable was done on time based on the requirements of the rules and regulations, and/or clients/stakeholders. Time-related performance indicators evaluate such things as project completion deadlines, time management skills and other time-sensitive expectations. Some Performances are only rated on quality and efficiency, some on quality and timeliness, and others on efficiency only. You need not use all three (3) categories. 25. Demonstration of Competencies. During Phase I, the rater shall discuss with the ratee the competencies required of the individual personnel. Competencies are defined as the knowledge, skills and behavior that individuals demonstrate in achieving oneās results. Competencies shall uphold the DepEdās core values. They represent the way individuals define and live the values. 26. DepEd shall adopt four classes of competencies as follows: i. Core behavioral competencies are competencies, which cut across the organization; ii. Leadership competencies are competencies intended for managerial positions; a. Third level officials b. Chiefs and Assistant Chiefs c. School Heads and Department Heads iii. Staff Core Skills are competencies intended for staff and teaching-related personnel; and iv. Teaching competencies are competencies intended for teachers. The DepEd-required competencies are illustrated in Annex I. 27. The rateeās demonstration of the required competencies shall be monitored to effectively plan the interventions needed for behavioral and professional development. The assessment in the demonstration of competencies shall not be reflected in the final rating. 28. Reaching Agreement. Once the office and individual KRAs, Objectives and Performance Indicators are clearly defined, the rater and the ratee shall commit and reach an agreement by signing the OPCRF and IPCRF. The signed/approved OPCRF and IPCRF shall be the basis for monitoring and assessment, which shall take place in Phases II and III, respectively. B. Phase II: Performance Monitoring and Coaching 29. The performance monitoring and coaching shall commence after the rater and the ratee commit on the KRAs, Objectives and Performance Indicators, and sign the OPCRF and IPCRF. This shall be done throughout the year. 30. The two (2) main components of Phase II are the following: i. Performance monitoring; and ii. Coaching and feedback. 31. Performance monitoring shall provide key inputs and objective basis for rating. It shall facilitate feedback and provide evidence of performance. Performance monitoring shall be the responsibility of both the rater and the ratee who agree to track and record significant incidents through the use of the Performance Monitoring and Coaching Form (PMCF) shown in Annex J. Significant incidents are actual events and behaviors in which both positive and negative performances are observed and documented. 32. Coaching and feedback shall be a continuous process. Coaching and feedback shall be provided by the rater and/or shall be sought by the ratee to improve work performance and behavior. The rater, as the coach or mentor of the ratee, playing a critical role in the performance monitoring and coaching, shall provide an enabling environment and intervention to improve the office performance and to manage and develop individual potentials. 33. The PMCF shall capture the significant incidents. It shall provide a record of demonstrated behaviors, competencies and performance, and shall be an effective substitute in the absence of quantifiable data. The rater and the ratee shall sign each significant incident recorded in the PMCF to ensure that agreement has been reached. C. Phase III: Performance Review and Evaluation 34. The performance review and evaluation shall be done at the end of the performance cycle to assess the office and individual employeeās performance level based on the commitments and measures as contained in the signed OPCRF and IPCRF. 35. A mid-year review is prescribed to determine the progress in achieving the Objectives. In exceptional cases, and only if the situation warrants, a one-time recalibration of office and individual Objectives shall be allowed during the mid-year review. Exceptional cases shall include instances when high level decisions are taken into effect such as changes in strategic directions, and circumstances beyond the control of the ratee such as natural and/or man-made calamities, including typhoon, earthquake and other fortuitous events. During the mid-year review, the rater shall inform in writing the ratee of the status of performance, in case of an Unsatisfactory or Poor performance. Coaching, feedback and appropriate interventions shall be provided where necessary. 36. The RPMS shall put premium on KRAs towards the realization of organizational vision, mission, strategic priorities and the OPIF logframe. Hence, rating for planned and/or intervening tasks shall always be supported by reports, documents or any output as proofs of actual performance. In the absence of said bases or proofs, a particular task shall not be rated and shall be disregarded. 37. Office and Individual Performance Assessment. The head of office, in coordination with the Planning Office, shall assess the performance of the office vis-a-vis the committed targets at the beginning of the performance cycle. The rater and the ratee shall discuss and agree on the individual assessment based on the actual accomplishments of each of the KRAs and Objectives. The final rating shall be based solely on the accomplishment of the specific objectives as measured by the Performance Indicators. The OPCRF and IPCRF shall be accomplished and completed by the rater and the ratee to: i. Reflect actual accomplishments and results; ii. Rate each of the objectives; iii. Compute for the score per objective; iv. Determine the overall rating for accomplishments; v. Reach an agreement; and vi. Assess the competencies. 38. Initial self-rating shall be encouraged prior to the rater-ratee discussion. 39. Third Level Officials, as heads of offices, shall accomplish the OPCRF for submission to the Planning Office. The individual assessment of Third Level Officials shall be contained in the CESPES Forms for submission to the Career Executive Service Board (CESB). The BHROD and Personnel Division shall be furnished a copy of both forms. 40. Actual Results. The rater and the ratee shall discuss and agree on the actual accomplishments and results based on the performance commitments and measures made at the beginning of the rating period. They shall evaluate each objective whether it has been achieved or not. The significant incidents as reflected in the PMCF shall be considered for the actual results. 41. Rating the Objectives. Based on the actual accomplishments and results, each of the Objectives shall be rated using the rating scale specified below: Table 2. The RPMS Rating Scale NUMERICAL RATING ADJECTIVAL RATING DESCRIPTION OF MEANING OF RATING 5 Outstanding Performance represents an extraordinary level of achievement and commitment in terms of quality and time, technical skills and knowledge, ingenuity, creativity and initiative. Employees at this performance level should have demonstrated exceptional job mastery in all major areas of responsibility. Employee achievement and contributions to the organization are of marked excellence. 4 Very Satisfactory Performance exceeded expectations. All goals, objectives and targets were achieved above the established standards. 3 Satisfactory Performance met expectations in terms of quality of work, efficiency and timeliness. The most critical annual goals were met. 2 Unsatisfactory Performance failed to meet expectations, and/or one or more of the most critical goals were not met. 1 Poor Performance was consistently below expectations, and/or reasonable progress toward critical goals was not made. Significant improvement is needed in one or more important areas. The final assessment shall correspond to the adjectival description of Outstanding, Very Satisfactory, Satisfactory, Unsatisfactory or Poor. The range of adjectival rating is as per attached in Forms A, B, and C. 42. Process for Computing the Score per KRA. i. The rater and ratee shall ensure that each KRA has been assigned weight according to priority. ii. As an option, the rater and ratee may assign weights to objectives which shall be equal to the total weight assigned to a particular KRA. KRA 1 ā Weight assigned is 40% Objective 1 is 20% Objective 2 is 10% Objective 3 is 10% iii. The score per KRA shall be computed using the following formula: 43. Plus Factor. The plus factor shall be considered as another KRA. These are value adding accomplishments, which are not covered within the regular duties and responsibilities. The weight on the plus factor shall not exceed the weight of the highest mandated KRA. For teachers, the plus factor shall be limited to work/activities, which contribute to the teaching-learning process. 44. Determining the Overall Rating for Accomplishments. The overall rating/assessment for the accomplishments shall fall within the following adjectival ratings and shall be in three (3) decimal points: Table 3. Adjectival Ratings RANGE ADJECTIVAL RATING 4.500-5.000 Outstanding 3.500-4.499 Very Satisfactory 2.500-3.499 Satisfactory 1.500-2.499 Unsatisfactory below 1.499 Poor 45. Reaching Agreement. Upon determining the overall rating for the actual accomplishments and results, the rater and the ratee shall reach an agreement by signing the OPCRF and IPCRF. The average rating of individual staff members should not go higher than the collective performance assessment of the office. 46. Assessing the Competencies. The rater shall discuss with the ratee the set of competencies observed during the performance cycle. The competencies shall not be reflected in the final rating. Competencies shall be monitored for developmental purposes. In evaluating the individualās demonstration of competencies, the rating scale in Table 4 shall apply: Table 4. The DepEd Competencies Scale SCALE DEFINITION 5 Role model 4 Consistently demonstrates 3 Most of the time demonstrates 2 Sometimes demonstrates 1 Rarely demonstrates 5 (role model) ā all competency indicators 4 (consistently demonstrates) ā four competency indicators 3 (most of the time demonstrates) ā three competency indicators 2 (sometimes demonstrates) ā two competency indicators 1 (rarely demonstrates) ā one competency indicator D. Phase IV: Performance Rewarding and Development Planning 47. The results of the performance review and evaluation shall be used in performance rewarding and development planning. This phase shall be done after Phase III. 48. The rater shall discuss and provide qualitative comments, observations and recommendations in the individual employeeās performance commitment, competency assessment and significant incidents which shall be used for training and professional development. These can be written under the strengths and development needs column of the Part IV-Development Plans of the IPCRF. 49. The rater and the ratee shall identify and discuss the individualās strengths and development needs, and reflect them in the Part IV-Development Plans of the IPCRF. The competencies which the ratee demonstrated consistently and the areas, where the ratee meet or exceed expectations shall be referred to as the rateeās strengths. The competencies, which the ratee rarely demonstrates and the areas where the ratee has room for improvement and has not met the expectations, shall be identified as the rateeās development needs. Make a situational SOLO-based questions in the context of school leadership