Track each student's skills and progress in your Mastery dashboards
Give this quiz to my class
Q 1/17
Score 0
60
Q 2/17
Score 0
60
17 questions
Q.
1
60 sec
1.S3.2h
Q.
2
60 sec
1.S3.2h
Q.
3
60 sec
1.S3.2h
Q.
The data table below shows some data related to the Sun and the planets in our solar system.
The distance between the Sun and Saturn is approximately six times the distance between the Sun and which other planet
4
60 sec
1.S3.2h
Q.
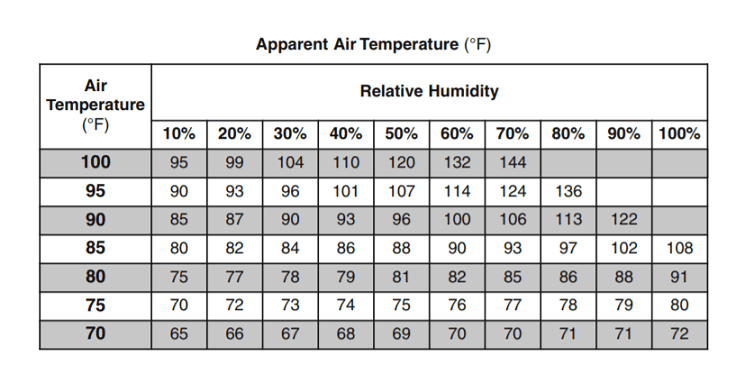
Base your answer on the table below and on your knowledge of science. The table shows some physical properties of four minerals.
Which mineral is hard and has the same color and streak?
5
60 sec
1.S3.2h
Q.
Base your answer on the table below and on your knowledge of science. The table shows some physical properties of four minerals.
Which physical property best distinguishes magnetite from pyrite?
6
60 sec
1.S3.2h
Q.
The graph below shows population data for one kind of insect over a 50-year period.
Which statement best describes the population of this insect over the 50-year period?
7
60 sec
1.S3.2h
Q.
8
60 sec
1.S3.2h
Q.
The graph below shows the relationship between the amount of light received by a plant and its rate of photosynthesis.
As the amount of light received by this plant increases, its rate of photosynthesis
9
60 sec
1.S3.2h
Q.
10
60 sec
1.S3.2h
Q.
11
60 sec
1.S3.2h
Q.
The graph below shows tidal changes at an ocean beach over a 24-hour time period.
What is the approximate time interval between the two high tides?