Feel free to use or edit a copy
includes Teacher and Student dashboards
Measures 4 skills from
Measures 4 skills from
With a free account, teachers can
- edit the questions
- save a copy for later
- start a class game
- automatically assign follow-up activities based on students’ scores
- assign as homework
- share a link with colleagues
- print as a bubble sheet
4 questions
Show answers
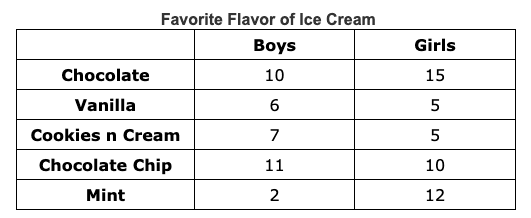
- Q1Mary asked children in her neighborhood their favorite flavor of ice cream. Their responses are shown in this table. Approximately what percent of boys chose chocolate chip or vanilla as their favorite flavor of ice cream?17%47%20%39%300sNC.8.SP.4
- Q2The scatterplot shows the relationship between children’s shoe size and growth in height. What is the relationship between shoe size and height?as shoe size increases, height of children stays the sameas shoe size increases, height of children increaseas shoe size decreases, height of children increasethere is no relationship between shoe size and height of children300sNC.8.SP.1
- Q3This graph shows a scatterplot and a linear model of its data. Which statement is true?The linear model represents the data well because most of the dots are above the line.The linear model does not represent the data well because most of the dots are above the line.The linear model represents the data well because some of the dots are on the line.The linear model does not represent the data well because not all of the dots are on the line.300sNC.8.SP.2
- Q4This scatterplot shows the number of hours each student studied and the grade scored. It was determined that y = 7.8x + 61 is a good model for the data set. What is the meaning of the slope of the linear model?A student will receive a grade of 61 by spending 1 hour studying.A student will receive a grade of 61 by spending no time studying.A student’s grade increased by about 1 point for every 7.8 hours studying.A student’s grade increased by about 7.8 points for every 1 hour studying.300sNC.8.SP.3

