Loading...
2nd Cycle Assessment#7 Mathematics 6
Quiz by Jaylord Arguelles
Tag the questions with any skills you have. Your dashboard will track each student's mastery of each skill.
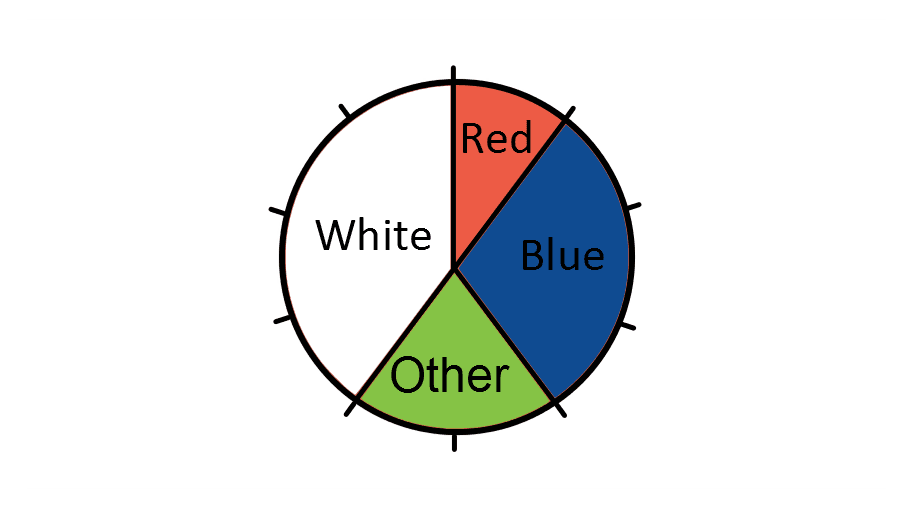
The pie chart shows the shirt colors of Basketball teams. If there are 20 teams, how many play in white?

4
8
10
6
It is a circular statistical graphic, which is divided into slices to illustrate numerical proportion. In a pie chart, the arc length of each slice is proportional to the quantity it represents
The pie chart shows the shirt colors of Basketball teams. If there are 20 teams, how many play in white?
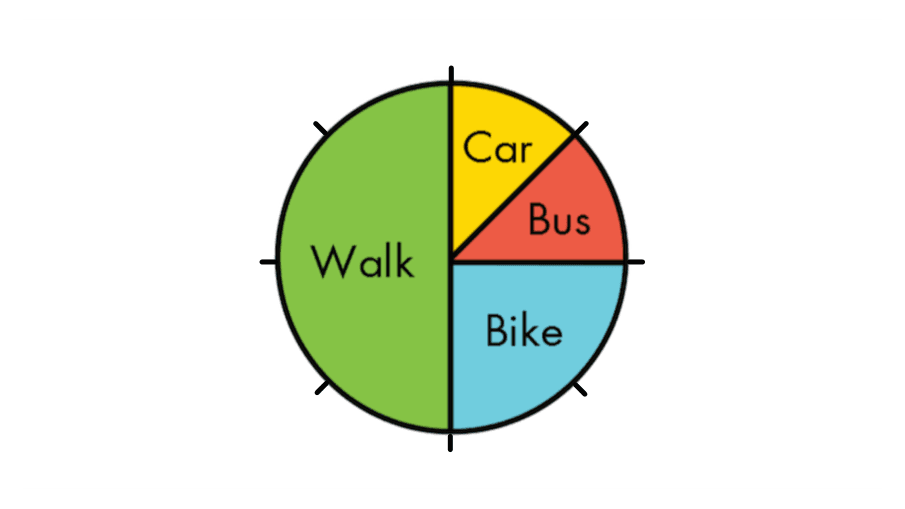
If 48 people were surveyed, how many got the bus to school?
If 40 people were surveyed, how many people liked hot chocolate best?

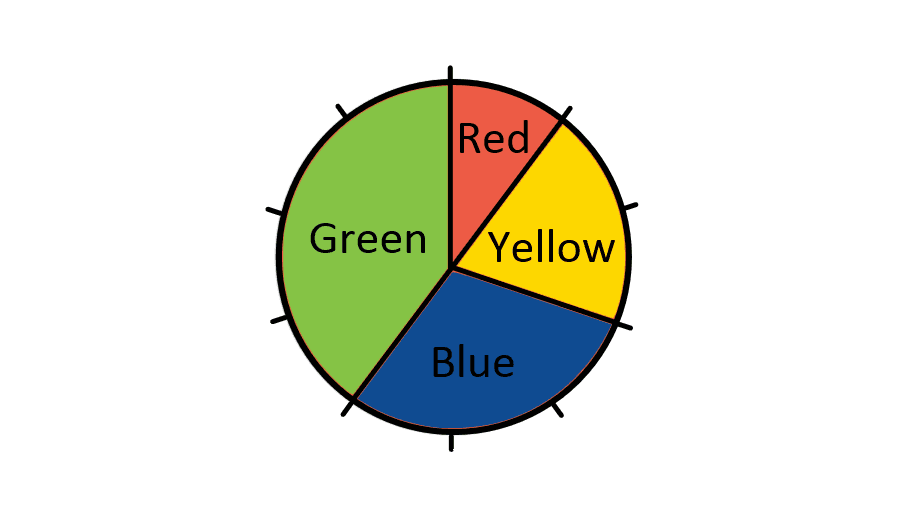
In a pie graph below, what is greater than Yellow and less than Green.

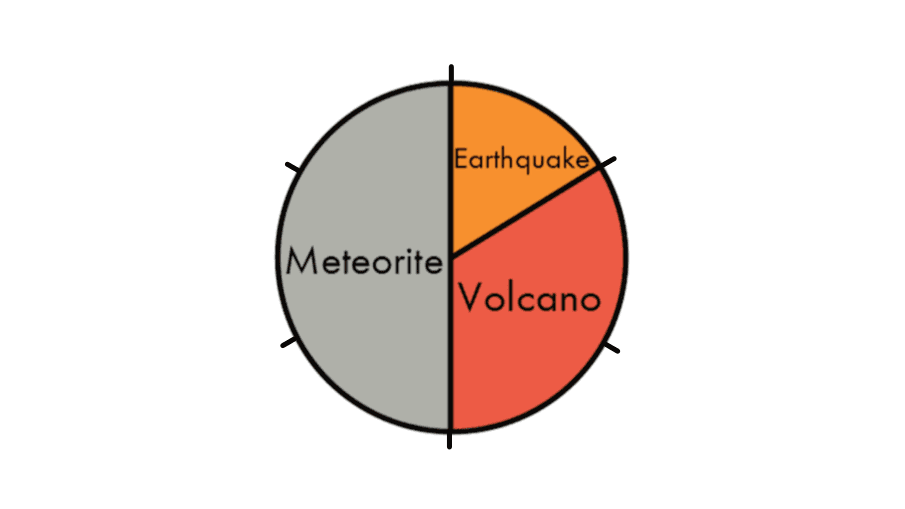
If 60 people were surveyed on what they thought caused the extinction of the dinosaurs, how many thought it was a meteorite or a volcano?
True or false: ¹⁄₄ of children were most interested in the Greek civilization.
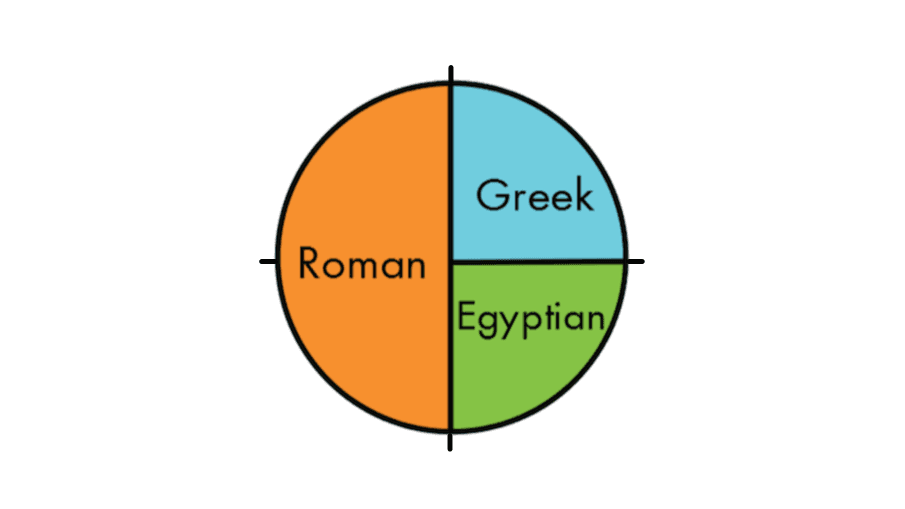
If 40 children were asked about what civilization they wanted to study next, how many said "Egyptian"?

True or false: ¹⁄₄ of children traveled to school by bus
If the whole pie chart represents 24 children, how many travels by bus?
If 30 people were surveyed on what they thought caused the extinction of the dinosaurs, how many thought it was a meteorite?
Link the section to the fraction:
If 40 people were surveyed and only 4 liked brussel sprouts best, what section of the pie chart would this be?
The pie chart shows the shirt colors of Premier League teams. If there are 20 teams, how many play in blue?

If 28 people were surveyed, how many people liked coffee best?
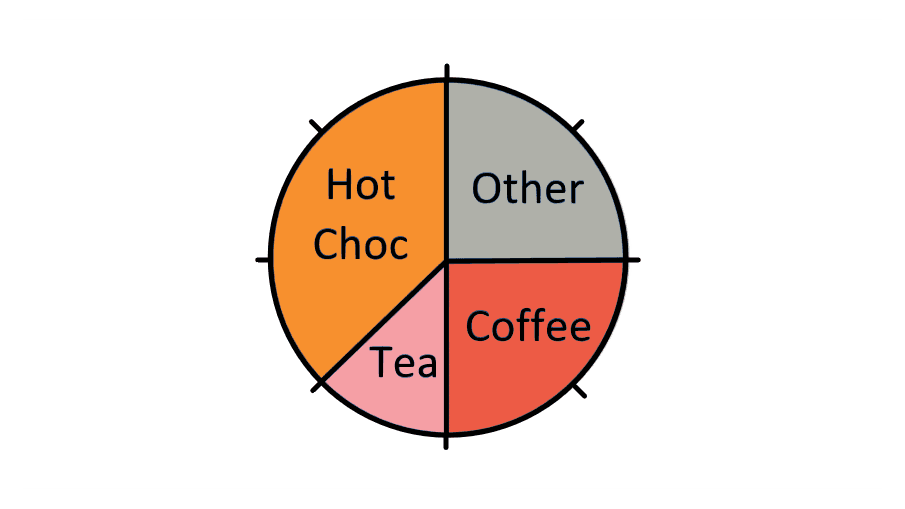
If 40 people were surveyed, how many people liked tea best?
If 36 people were surveyed on what they thought caused the extinction of the dinosaurs, how many thought it was a volcano?

If 32 people were surveyed, how many walked or biked to school?

If 60 people were surveyed and 24 said they liked football best, what section of the pie chart would this be?

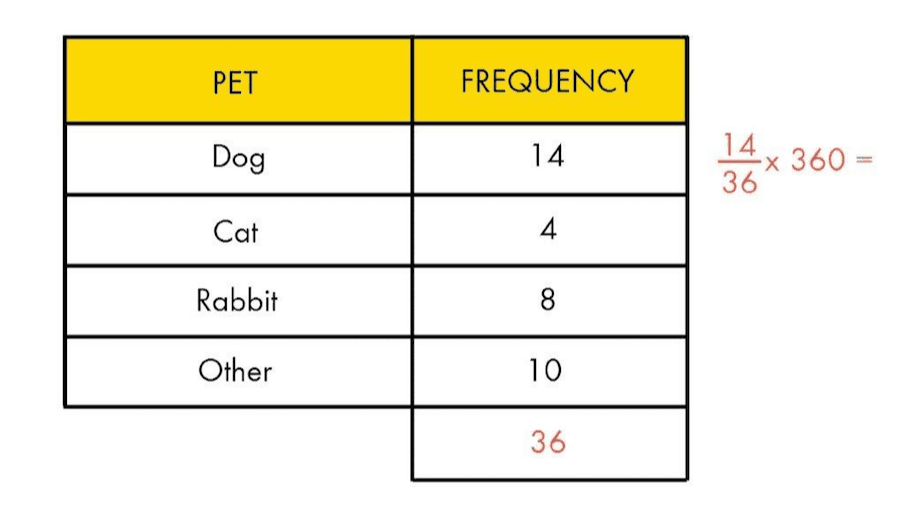
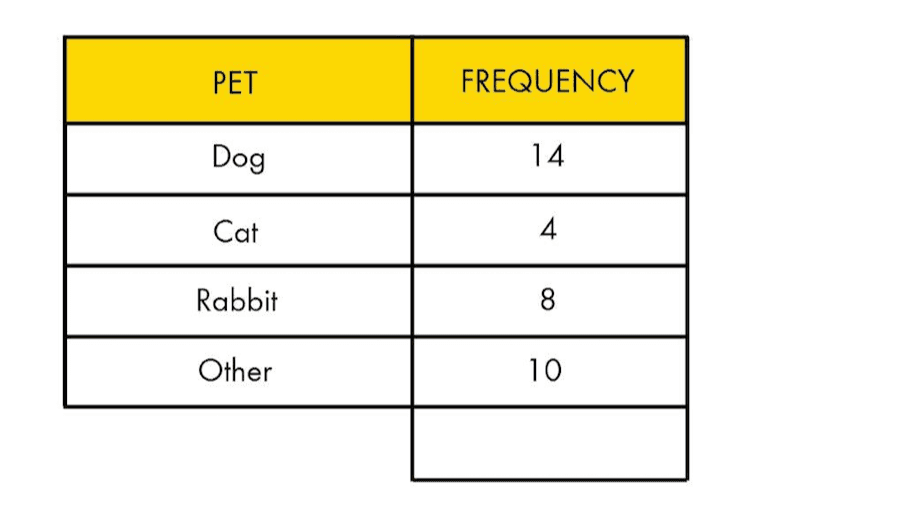
I asked people to think of the first pet animal that came into their heads. The table shows the results. How many people did I ask?

If 36 people were asked, what fraction thought "Dog"?
Link the category to the angle needed in the pie chart:
Which pie chart do you think best represents the information we have been working on?
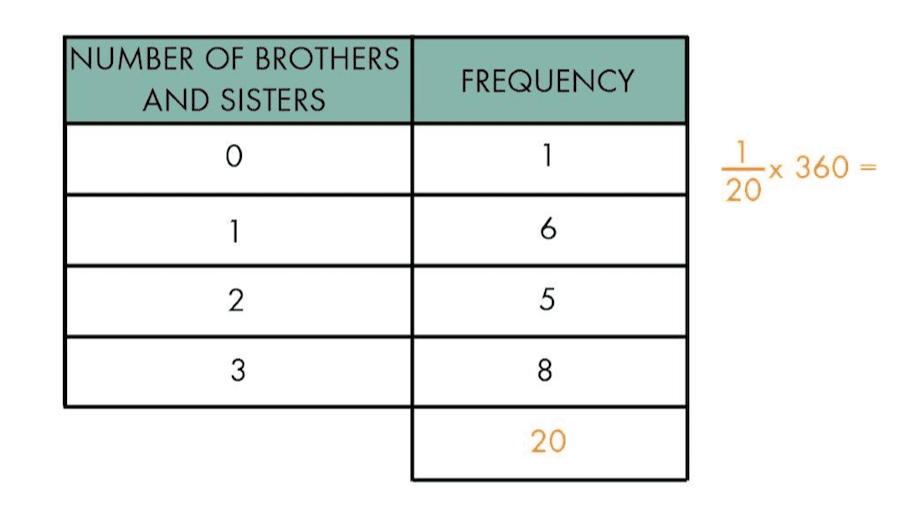
My pie chart represents 20 people. Complete the calculations in the diagram and link the angles to the categories (you may use a calculator if you wish.)
I asked 30 children about their favourite Disney character. Exactly 15 said "Mickey Mouse". What angle, in degrees, would represent this on a pie chart?