Loading...
3/28/23 PICTOGRAPHS
Quiz by Yvette Barcelo
Track each student's skills and progress in your Mastery dashboards
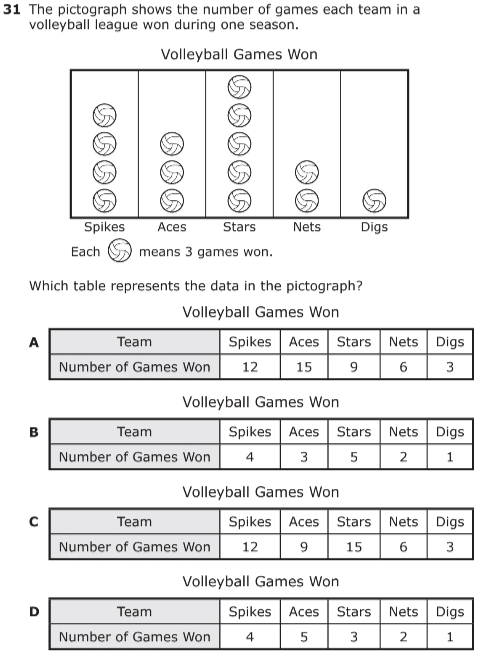
1. The pictograph shows the number of games each team in a volleyball league won during one season. Which table represents the data in the pictograph?
C
B
D
A
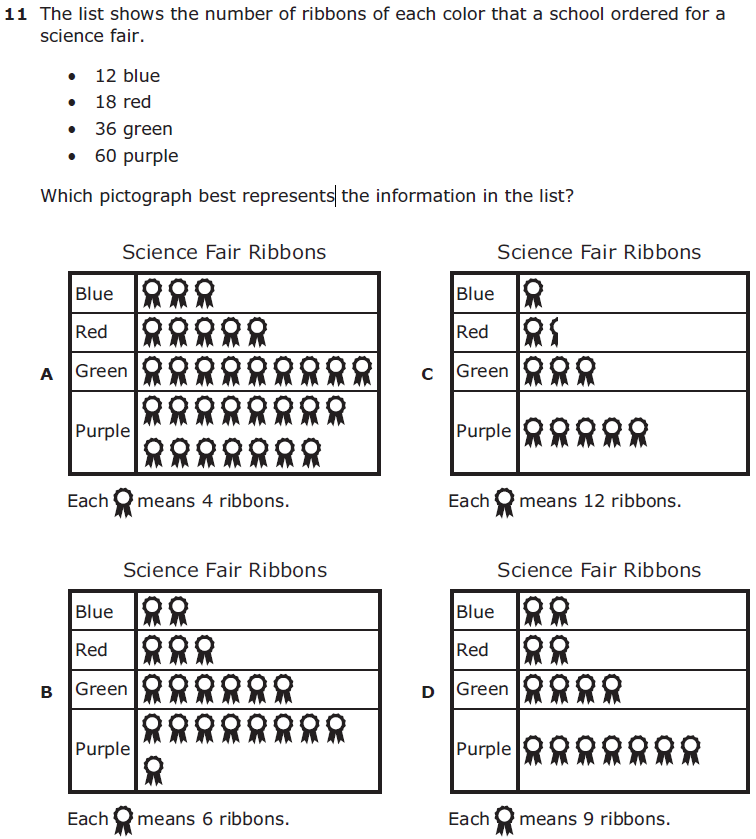
2. The list shows the number of ribbons of each color that a school ordered for a science fair.
- 12 blue
- 18 red
- 36 green
- 60 purple
which pictograph best represents the information in the list?
C
A
B
D
1. The pictograph shows the number of games each team in a volleyball league won during one season. Which table represents the data in the pictograph?

2. The list shows the number of ribbons of each color that a school ordered for a science fair.
- 12 blue
- 18 red
- 36 green
- 60 purple
which pictograph best represents the information in the list?

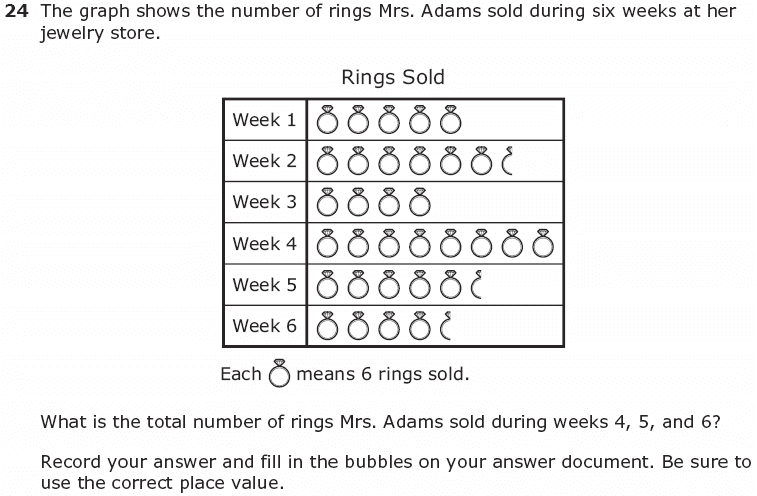
3. The graph shows the number of rings Mrs. Adams sold during six weeks at her jewelry store.
What is the total number of rings Mrs. Adams sold during weeks 4, 5, and 6?
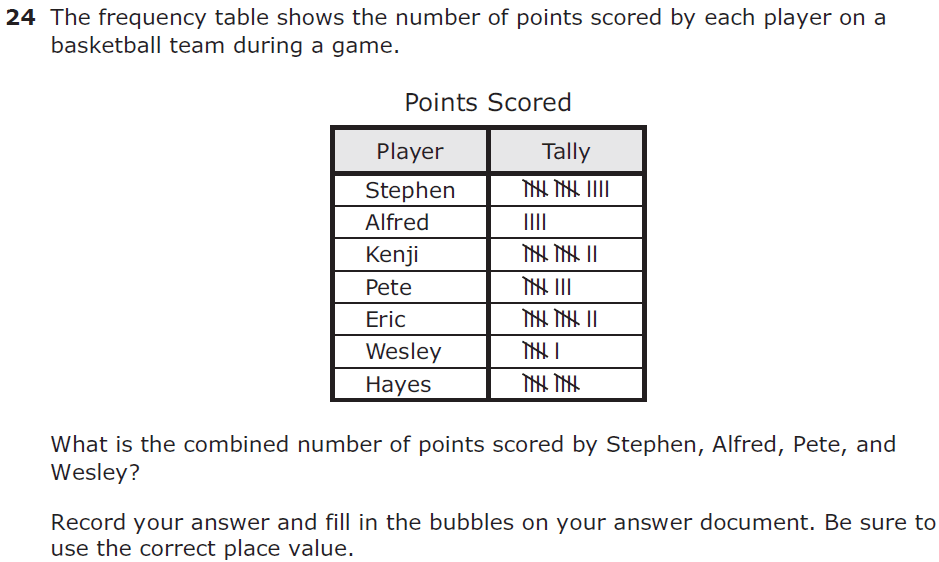
4. The frequency table shows the number of points scroed by each player on a basketball team during a game.
What is the combined number of points by Stephen, Alfred, Pete, and Wesley?