3Is - Quarter4 - Quiz 1
Quiz by C C
Feel free to use or edit a copy
includes Teacher and Student dashboards
Measure skillsfrom any curriculum
Tag the questions with any skills you have. Your dashboard will track each student's mastery of each skill.
- edit the questions
- save a copy for later
- start a class game
- automatically assign follow-up activities based on students’ scores
- assign as homework
- share a link with colleagues
- print as a bubble sheet
- Q1
In the formula =COUNTIF(A1:A5, B1), what will be the output if the values in range A1 to A5 are 1, 2, 3, 3, 5) and B1 is 3?
The output will be 3 if the value of B1 is 3.
The output will be 1 if the value of B1 is 5.The output will be 3.
The output will be 2.45s - Q2
Which of the following statements is/are true?
To get the spread of your data is to measure the central tendency of your data set.
To get the middle of your data is to measure the variability of your data set.
The level of measurement decides which descriptive statistics can be applied on your data.The higher the level of measurement, the lesser mathematical operations that you can apply.45s - Q3
Which of the following tools is/are used to measure the central tendency of a nominal data?
Median
Mean
Tool to get the most frequent response value.Mode45s - Q4
Which of the following tools is/are used to measure the central tendency of a ratio data?
Median, modeFrequency
Mean, median, modeMean, median30s - Q5
Given the following 3Is grade of 10 TVL students- 80, 85, 80, 75, 78, 75, 90, 90, 80, 80. Which of the following statements is/are correct?
The frequency of students who got 75 is 2.The frequency of students who got 90 is 3.
The frequency of students who got 80 is 4.The frequency of students who got 85 is 2.
30s - Q6
Given the following 3Is grade of 5 TVL students- 80, 85, 80, 75, 78 entered in Sheet1 cells A2 to A6 respectively. Which ofthe following statements is/are correct to get the average grade?
It can be manually computed as
It can be manually computed asThe average grade when computed manually is 78.
It can be computed using the formula =AVERAGE(A2colonA6)45s - Q7
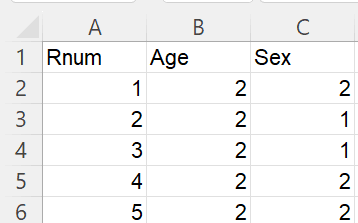
Given the worksheet in MS Excel with the data as shown in the picture. The data for sex is coded as 1 for Male and 2 for Female. What is the correct formula to get the frequency of Male respondents?
=COUNTIF(C2colonC5;1)=COUNTIF(C2colonC6;1)=COUNTIF(C2colonC5;2)
=COUNTIF(B2coloB6;2)
45s