Draw a scaled picture graph and a scaled bar graph to represent a data set with several categories. Solve one- and two-step "how many more" and "how many less" problems using information presented in scaled bar graphs. For example, draw a bar graph in which each square in the bar graph might represent 5 pets.
Track each student's skills and progress in your Mastery dashboards
Give this quiz to my class
Q 1/5
Score 0
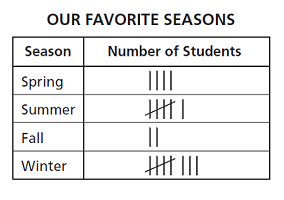
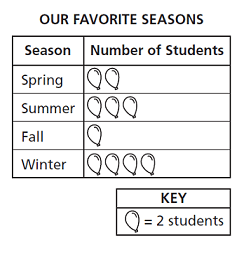
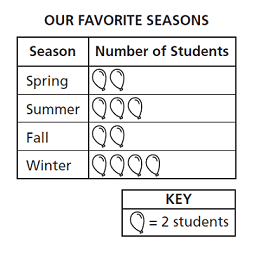
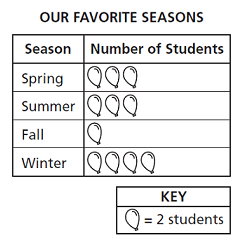
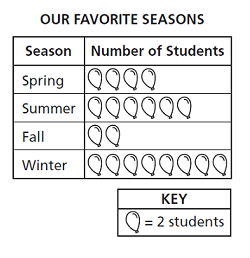
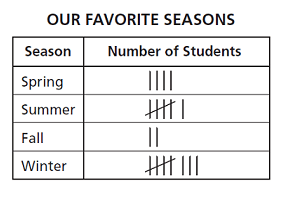
The tally chart below shows the favorite seasons of Mr. Slater's students.
Which picture graph correctly shows the data?
60
Q 2/5
Score 0
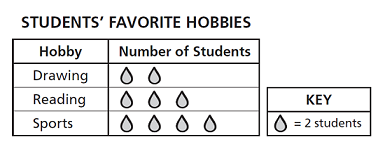
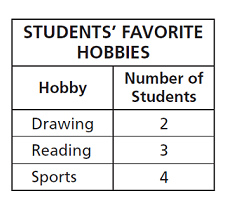
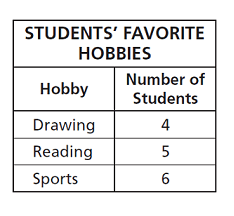
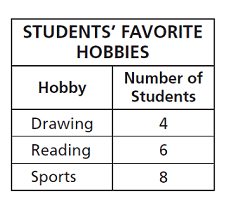
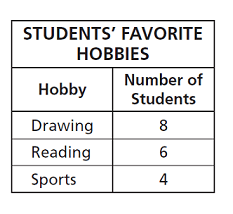
Mr. Stone asked each of his students to name one favorite hobby. He made the picture graph shown below to display the data.
Which table represents the same data as the picture graph?
60
5 questions
Q.
The tally chart below shows the favorite seasons of Mr. Slater's students.
Which picture graph correctly shows the data?
1
60 sec
3.MD.B.3
Q.
Mr. Stone asked each of his students to name one favorite hobby. He made the picture graph shown below to display the data.
Which table represents the same data as the picture graph?