Loading...

3rd Cycle Assessment#7 Mathematics 7
Quiz by Jaylord Arguelles
Tag the questions with any skills you have. Your dashboard will track each student's mastery of each skill.
What is the total frequency?
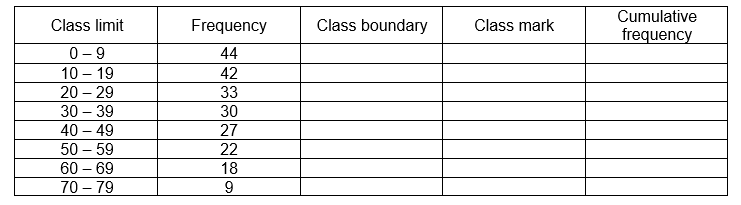
200
215
205
225
A collection of observation produced by sorting them into classes and showing their frequency of occurrence in each class.
What is the total frequency?

Sam had 15 soccer games this season. His team scored the following goals for each game:
1,2,0,3,1,1,0,2,1,3,0,2,1,1,3
According to the portion of the frequency table given, how many people have an MBA?

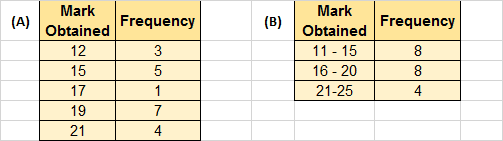
Given above are marks obtained by 20 students in Math out of 25.
How many students score 19?
Given both table above are marks obtained by 20 students in Math out of 25. What are different between the tables?
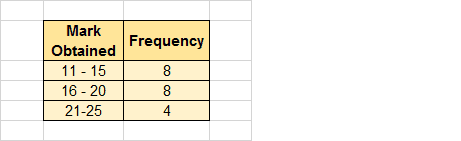
Given above are marks obtained by 20 students in Math out of 25 presented in grouped frequency distribution table.
How many classes are in this table?
This is the interval between two consecutive upper (or lower) class limits.
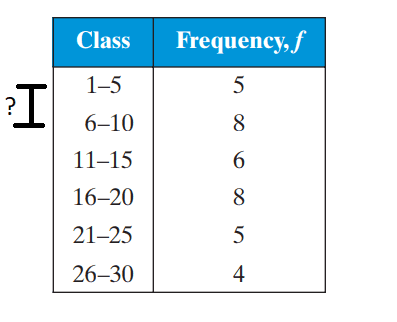
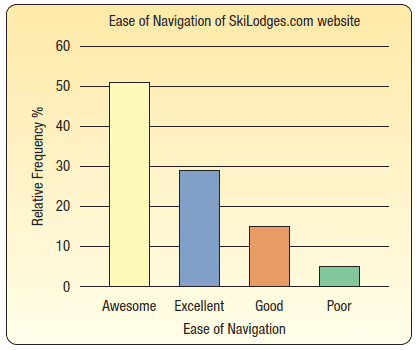
What is the chart called?

What do you call the given chart?
In the given table, what is the class size?
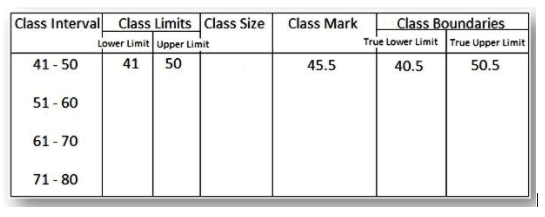
In the given frequency distribution, what is the lower limit of the 3rd interval?

This frequency table is set up correctly.

Given the following class limit, what would the class boundary be?
20 - 22
Find the range from the following data...
1, 8, 3, 2, 8, 8
Find the range from the following data...
5, 3, 6, 5, 3, 9, 4
How many scores were 26 or below?
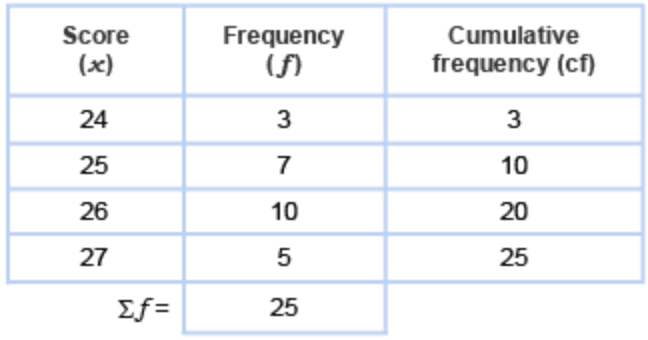
What is the first number in the cumulative frequency column?
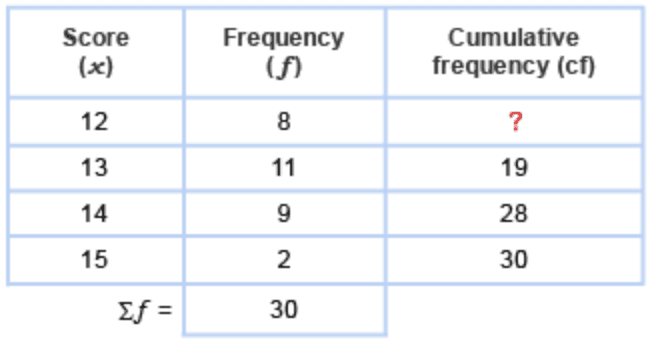
A clumsy teacher spilled coffee over this table of his students' test results. How many students scored below 18?

The maximum temperature (°C) for each day in March and April was recorded.
What was the number of days with temperature above 25°C?
