Interpret in context the rate of change and the intercept of a linear model. Use the linear model to interpolate and extrapolate predicted values. Assess the validity of a predicted value.
Analyze patterns and describe relationships between two variables in context. Using technology, determine the correlation coefficient of bivariate data and interpret it as a measure of the strength and direction of a linear relationship. Use a scatter plot, correlation coefficient, and a residual plot to determine the appropriateness of using a linear function to model a relationship between two variables.
Track each student's skills and progress in your Mastery dashboards
Loading...
Loading...
Loading...
Give this quiz to my class
Q 1/3
Score 0
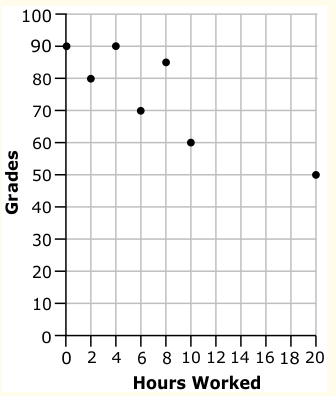
Kesha asked seven friends what their math grades are and how many hours they worked each week. She plotted the results in this graph. The data can be modeled with the best-fit linear function. Based on this model, what is the approximate time spent working each week for a student whose math grade is 71?
300
9 hours
6 hours
15 hours
11 hours
Q 2/3
Score 0
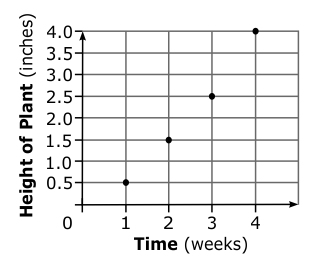
The scatterplot below shows the height of a plant for four weeks. Based on a linear model, how tall would the plant be in 5 weeks?
300
4.0 inches
5.0 inches
4.5 inches
6.0 inches
3 questions
Q.
Kesha asked seven friends what their math grades are and how many hours they worked each week. She plotted the results in this graph. The data can be modeled with the best-fit linear function. Based on this model, what is the approximate time spent working each week for a student whose math grade is 71?
1
300 sec
NC.M1.S-ID.7
Q.
The scatterplot below shows the height of a plant for four weeks. Based on a linear model, how tall would the plant be in 5 weeks?
2
300 sec
NC.M1.S-ID.7
Q.
The graph below shows the ages of puppies and their corresponding weights.
Which statement is true?