solve one- and two-step problems using data in whole number, decimal, and fraction form in a frequency table, dot plot, or stem-and-leaf plot
Track each student's skills and progress in your Mastery dashboards
Loading...
Loading...
Loading...
Give this quiz to my class
Q 1/3
Score 0
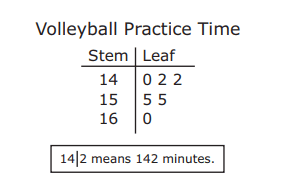
Karnika recorded the number of minutes she practiced volleyball each week for several weeks. She used a stem and leaf plot to organize the data. Based on the data, what is the amount of time in minutes Karnika practiced volleyball?
60
894 min
597 min
1,224 min
594 min
Q 2/3
Score 0
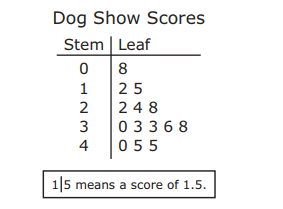
The stem and leaf plot shows the scores given to the dogs at a dog show. Possible scores were between 0.1 and 5.0. What is the difference between the highest score and the lowest score shown in the stem and leaf plot?
60
4.3
0.47
0.25
3.7
3 questions
Q.
Karnika recorded the number of minutes she practiced volleyball each week for several weeks. She used a stem and leaf plot to organize the data. Based on the data, what is the amount of time in minutes Karnika practiced volleyball?
1
60 sec
4.9.B: Data Analysis
Q.
The stem and leaf plot shows the scores given to the dogs at a dog show. Possible scores were between 0.1 and 5.0. What is the difference between the highest score and the lowest score shown in the stem and leaf plot?
2
60 sec
4.9.B: Data Analysis
Q.
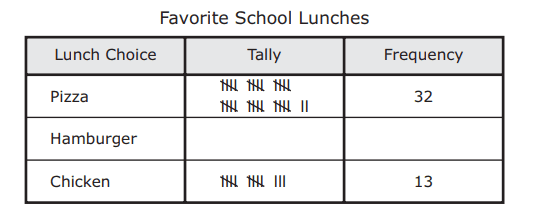
The frequency table shows the favorite school lunches of some students. The table is missing the information for the number of students who chose a hamburger.The number of students who chose a hamburger is half the number of students who chose pizza. How many students chose a hamburger or chicken as their favorite school lunch?
Be sure to use the correct place value.