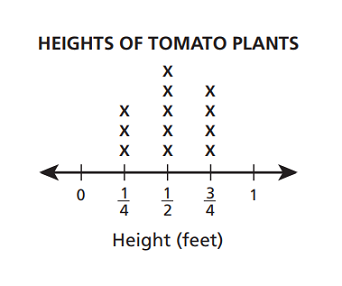
Make a line plot to display a data set of measurements in fractions of a unit (1/2, 1/4, 1/8). Solve problems involving addition and subtraction of fractions by using information presented in line plots. For example, from a line plot find and interpret the difference in length between the longest and shortest specimens in an insect collection.
Track each student's skills and progress in your Mastery dashboards
Give this quiz to my class
Q 1/4
Score 0
60
Q 2/4
Score 0
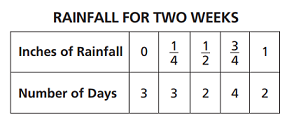
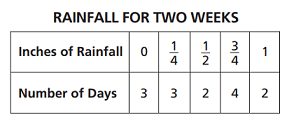
For a science project, Joseph recorded the amount of rainfall each day for 2 weeks. The table below shows his data.
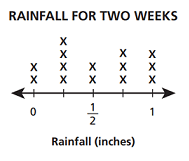
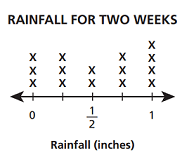
Which line plot correctly displays Joseph's data?
60
4 questions
Q.
1
60 sec
4.MD.B.4
Q.
For a science project, Joseph recorded the amount of rainfall each day for 2 weeks. The table below shows his data.
Which line plot correctly displays Joseph's data?