


5.13.B Interpret Factual/Quantitative Information Presented In Different Visual Representations
Quiz by Texas Education Agency
Grade 5
ELAR (2009)
Texas Essential Knowledge and Skills (TEKS)
Feel free to use or edit a copy
includes Teacher and Student dashboards
Measures 1 skill from
Measures 1 skill from
Track each student's skills and progress in your Mastery dashboards
With a free account, teachers can
- edit the questions
- save a copy for later
- start a class game
- automatically assign follow-up activities based on students’ scores
- assign as homework
- share a link with colleagues
- print as a bubble sheet
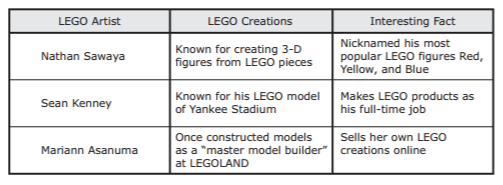
- Q 1/3Score 0What information can the reader learn about Nathan Sawaya and Sean Kenney from the chart below paragraph 7?29Where their art can be viewedHow their art can be purchasedWhy they enjoy working with LEGO piecesWhat they have created using LEGO pieces


3 questions
Show answers
- Q1What information can the reader learn about Nathan Sawaya and Sean Kenney from the chart below paragraph 7?Where their art can be viewedHow their art can be purchasedWhy they enjoy working with LEGO piecesWhat they have created using LEGO pieces60s5.13.B: Reading - Comprehension of Informational Text - Procedural Texts
- Q2Why is the boxed information at the end of the article included?To provide details a museum visitor would need to knowTo share information about the history of the museumTo show that the museum welcomes people of all agesTo describe some of the many exhibits at the museum60s5.13.B: Reading - Comprehension of Informational Text - Procedural Texts
- Q3The bar graph included with the selection helps the reader better understand —the factors that allow the bristlecone to live for so longthat other trees live in an environment similar to that of the bristleconewhy some regions produce trees that live as long as the bristleconethat the life spans of trees can vary greatly60s5.13.B: Reading - Comprehension of Informational Text - Procedural Texts

