Loading...
5th Grade Data & Statistics 2023
Quiz by Amy Mosher
Tag the questions with any skills you have. Your dashboard will track each student's mastery of each skill.
Is this a statistical question? What is the favorite restaurant of the students in my grade level?
An outlier will always affect the mean of a data set.
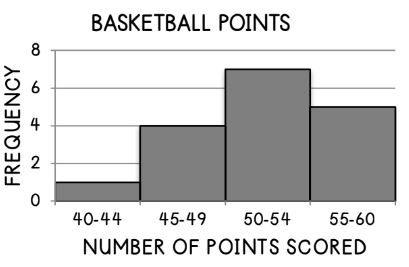
Which interval has the highest frequency?

How many more times did this team score 50-54 points than score 45-49 points?
The mode will always be affected by the outlier.
An outlier will always cause the range to increase.
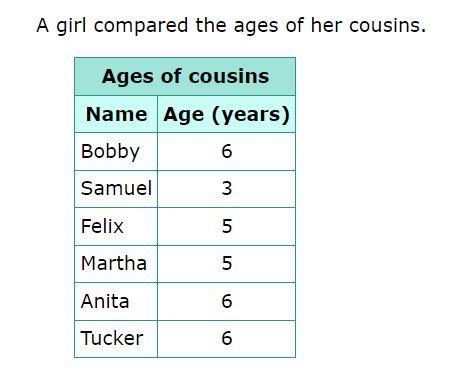
What is the mode of this data set?

What is the median of this data set?
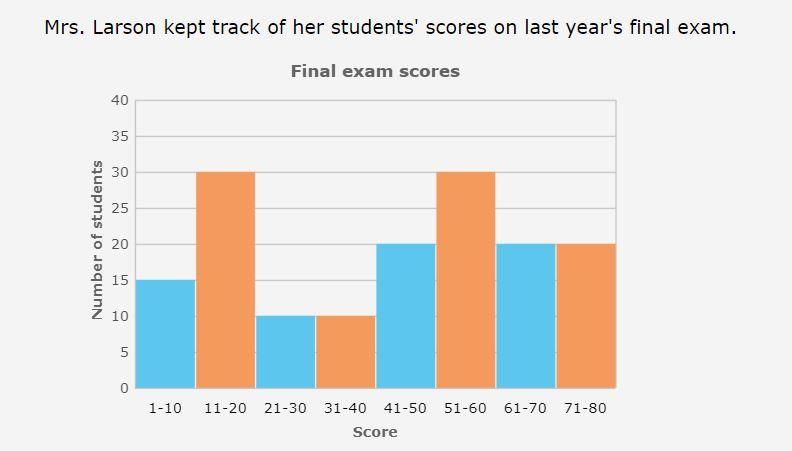
How many students took this exam?

An outlier cannot change the median.
How many students scored more than 40 points on the exam?
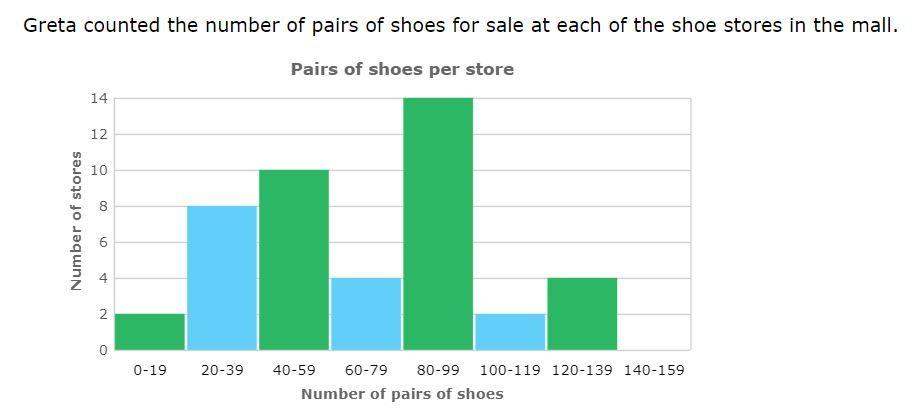
How many shoes are represented in this histogram?

What percent of stores had 80 or more shoes for sale? (Round to the nearest whole number.)
Joe rolls a number cube 12 times and records the results. Then he uses his results to make a dot plot. The dot plot shows 2 dots over each of 6 numbers. Which statement correctly describes Joe's results?
Dan asked 12 people how many cousins they have. The most common answer was 4. Which statement must be true about a dot plot of Dan’s data?
Is it statistical? How many books did you read this year?
Thomas is counting the dandelions in the backyards in his neighborhood. He counts 12 dandelions in each of the first 9 backyards he visits. There are are 2 dandelions in the tenth backyard. What is the average number of dandelions in a backyard in Thomas' neighborhood?
What fraction of the samples have a salt content greater than 38 grams?

A value much greater or much less than the others in a data set is called an:
The ________________________________ are used to describe the middle of a data set.
Is it statistical? How many Oreos can each pair of fifth graders stack in one minute?
Joy has the following set of data. If the mean is 12, what could the missing number be?

Which statement is true about this dot plot?

Which statement is true of this dot plot?
