summarize numeric data with numerical summaries, including the mean and median (measures of center) and the range and interquartile range (IQR) (measures of spread), and use these summaries to describe the center, spread, and shape of the data distribution
Track each student's skills and progress in your Mastery dashboards
Give this quiz to my class
Q 1/4
Score 0
The list shows the number of licenses issued every year to lobster boats in Massachusetts for a five-year period.
551, 554, 529, 534, 530
What is the range of these data?
60
25
534
540
21
Q 2/4
Score 0
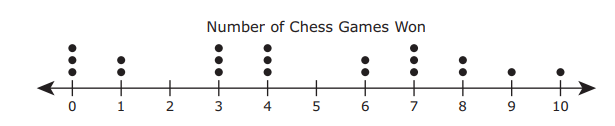
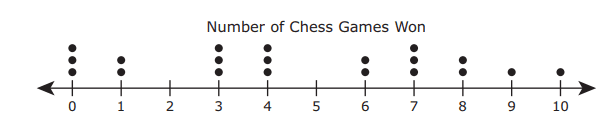
The dot plot shows the number of chess games won by each of the 20 students in a competition. Which statement about the data is true?
60
The median is 4, and the interquartile range is 5.
The median is 5, and the interquartile range is 10.
The median is 4, and the interquartile range is 10.
The median is 5, and the interquartile range is 5.
4 questions
Q.
The list shows the number of licenses issued every year to lobster boats in Massachusetts for a five-year period.
551, 554, 529, 534, 530
What is the range of these data?
1
60 sec
6.12.C: Measurement and Data
Q.
The dot plot shows the number of chess games won by each of the 20 students in a competition. Which statement about the data is true?
2
60 sec
6.12.C: Measurement and Data
Q.
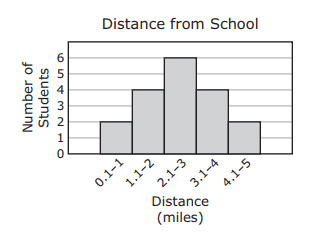
The distance in miles that some students live from school is shown in the histogram. Which statement about the data in the histogram is true?
3
60 sec
6.12.C: Measurement and Data
Q.
The list shows the area in square feet of each apartment available for rent in a building.
565, 961, 867, 517, 627, 714, 517, 728 .
What is the range of these areas in square feet? Be sure to use the correct place value