summarize categorical data with numerical and graphical summaries, including the mode, the percent of values in each category (relative frequency table), and the percent bar graph, and use these summaries to describe the data distribution
Track each student's skills and progress in your Mastery dashboards
Give this quiz to my class
Q 1/4
Score 0
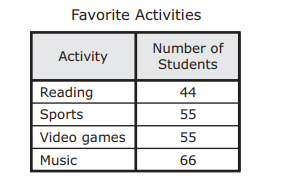
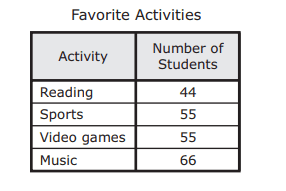
Hector surveyed all the sixth graders at his school about their favorite after-school activity. The table shows the results that were used to make a bar graph. Which percentage bar graph best represents the data?
60
#texas/4daf418f-93c7-4024-a563-b97efbd1e6bb/D.png
#texas/4daf418f-93c7-4024-a563-b97efbd1e6bb/B.png
#texas/4daf418f-93c7-4024-a563-b97efbd1e6bb/C.png
#texas/4daf418f-93c7-4024-a563-b97efbd1e6bb/A.png
Q 2/4
Score 0
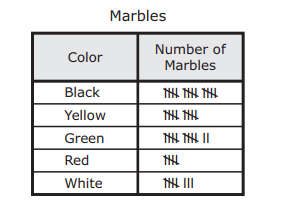
Shemar bought a bag of marbles. He took the marbles out of the bag one at a time. He recorded the color of each marble in this tally chart.In which table do the percentages represent the relative frequency of these marble colors?
60
#texas/262015b9-dea1-4ffe-a5ba-b2244dc5d503/B.png
#texas/262015b9-dea1-4ffe-a5ba-b2244dc5d503/C.png
#texas/262015b9-dea1-4ffe-a5ba-b2244dc5d503/A.png
#texas/262015b9-dea1-4ffe-a5ba-b2244dc5d503/D.png
4 questions
Q.
Hector surveyed all the sixth graders at his school about their favorite after-school activity. The table shows the results that were used to make a bar graph. Which percentage bar graph best represents the data?
1
60 sec
6.12.D: Measurement and Data
Q.
Shemar bought a bag of marbles. He took the marbles out of the bag one at a time. He recorded the color of each marble in this tally chart.In which table do the percentages represent the relative frequency of these marble colors?
2
60 sec
6.12.D: Measurement and Data
Q.
As part of a survey, a group of people were asked to name their preferred method of viewing television shows. Their responses are shown in the table. Which percentage bar graph best represents the data?
3
60 sec
6.12.D: Measurement and Data
Q.
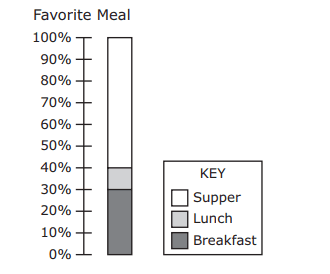
The students in a class were each asked to name their favorite meal of the day. The results are shown in this percentage bar graph. Which table could be represented by the percentage bar graph?