Feel free to use or edit a copy
includes Teacher and Student dashboards
Measures 1 skill from
Measures 1 skill from
Track each student's skills and progress in your Mastery dashboards
With a free account, teachers can
- edit the questions
- save a copy for later
- start a class game
- automatically assign follow-up activities based on students’ scores
- assign as homework
- share a link with colleagues
- print as a bubble sheet
7 questions
Show answers
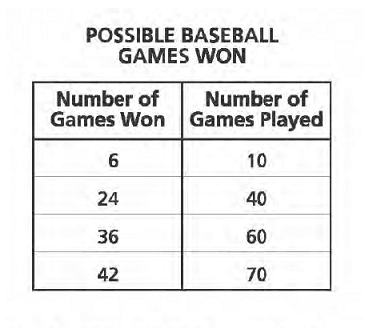
- Q160s6.RP.A.3.A
- Q260s6.RP.A.3.A
- Q360s6.RP.A.3.A
- Q4A bakery sells 5 apple muffins for every 2 bran muffins sold. Which table shows this ratio?60s6.RP.A.3.A
- Q5The ratio of students to adults on a field trip is 8 to 1. Which table correctly shows this ratio for each grade?60s6.RP.A.3.A
- Q6A machine fills boxes at a constant rate. At the end of 35 minutes, it has filled 5 boxes. Which table represents the relationship between the number of minutes the machine fills boxes and the number of boxes it has filled?60s6.RP.A.3.A
- Q7A bakery made 9 cakes using 3 bags of flour. The bakery uses the same relationship between cakes made and the amount of flour used to make all of their cakes. Which table of values shows the relationship between the number of cakes the bakery makes to the number of bags of flour the bakery uses?60s6.RP.A.3.A

