Tag the questions with any skills you have. Your dashboard will track each student's mastery of each skill.
Give this quiz to my class
Q 1/36
Score 0
A large city has just experienced an earthquake and the sewage pipes that were installed underground have broken. What could be a possible result of this breakage?
30
The amount of freshwater in the ground will decrease because it will flow into the pipes.
The groundwater supply will not be affected and will remain safe to drink and use for other purposes.
The groundwater supply will become polluted as material from the broken pipes flows out.
Q 2/36
Score 0
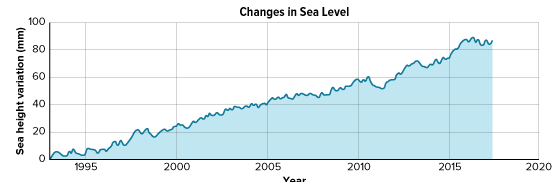
The graph shows changes in sea level since 1993.
What trend do you observe in the data?
30
Sea level has decreased over time.
Sea level has gone up and down over time.
Sea level has increased over time.
Sea level has remained steady over time.
36 questions
Q.
A large city has just experienced an earthquake and the sewage pipes that were installed underground have broken. What could be a possible result of this breakage?
1
30 sec
Q.
The graph shows changes in sea level since 1993.
What trend do you observe in the data?
2
30 sec
Q.
A student is asked to distinguish an organ from the other levels of organization in plants: cells, tissues, and organ systems.
Which statement describes only an organ?
3
30 sec
Q.
Refer to the image to answer the question.
Which correctly states how this image should be completed?
4
30 sec
Q.
Which is not included in the levels of organization between cell and organism?
5
30 sec
Q.
A student is given an unknown sample in science class. Which question would help the student to identify if the structure contains a tissue?
6
30 sec
Q.
How are asexual and sexual reproduction similar?
7
30 sec
Q.
Refer to the image to answer the question.
What level of organization is demonstrated?
8
30 sec
Q.
Refer to the image to answer the question.
A student is asked to place the levels of organization in order from most complex to least complex. Which order is correct?
9
30 sec
Q.
The sexual reproduction between two purple pea plants produces both purple and white offspring. Which of the four statements best describes the offspring?
10
30 sec
Q.
A student is working with a professor at a university. She creates a diagram to communicate their research on different organisms. Based on the diagram, which of the organisms would you expect to have the least genetic diversity?
11
30 sec
Q.
Part 11 A:
The image shows a bird gathering food.
Based on the information in the image, how will natural selection affect the population of bugs over generations?
12
30 sec
Q.
Four students were asked to compare the diversity of offspring in organisms that reproduce by asexual and sexual reproduction. Which table was filled out correctly?
13
30 sec
Q.
A student made this diagram of how the traits of teosinte changed over time.
What is best shown in the diagram?
14
30 sec
Q.
The Venn diagram can be used to compare characteristics of asexual and sexual reproduction. Which characteristic could be placed in the Both section of the Venn Diagram?
15
30 sec
Q.
A student is filling in the following table to help explain how the occurrence of traits in a population of field mice changed over generations.
If the environment stays the same, what best describes how natural selection will affect the traits in this population in generations 6, 7, and 8?
16
30 sec
Q.
A student is carrying out research on a species of plants in a rainforest, and records information about traits of the plants in the table.
If the rainforest became warmer and drier, which trait would become more common in the population?
17
30 sec
Q.
The diagram shows how the traits in a population of moths changed over time. This change happened at a time when pollution changed the color of tree bark in the ecosystem from light to dark. The moth population is a food source for birds in the ecosystem.
Which describes a process that likely changed the characteristics of the moth population?
18
30 sec
Q.
Part A 21: The graph shows the relationship between several generations of offspring of an organism and each generation’s genetic diversity. Select the correct statement.
19
30 sec
Q.
Part 21 B: The organism in Part A continues to reproduce. Four graphs predict the relationship between the offspring in generations 5, 6 and 7 and genetic diversity. Which graph best describes this relationship?
20
30 sec
Q.
A scientist observed a change in a bird species’ beak shape over five generations. This bird species lives on an isolated island.
Which is the most likely conclusion the scientist could draw about this change?
21
30 sec
Q.
Which of the following statements about plant and animal organs is correct?
22
30 sec
Q.
All dog breeds today are descended from wolves. Over many generations their traits have changed to develop all of the dog breeds present today. This is an example of ________________________ selection.
23
30 sec
Q.
Human activities can have beneficial or harmful influences on the groundwater in an area. The figure shows a busy farming area. Which activity could be beneficial to the groundwater on the farm?
24
30 sec
Q.
The graph shows how long it takes for some types of trash to biodegrade in the ocean.
Which statement best describes the data in the graph?
25
30 sec
Q.
Groundwater is the primary source of drinking water for approximately 1/3 of the people living in the United States. Which activity could be harmful to the groundwater supply in a particular area?
26
30 sec
Q.
The table shows sources of ocean pollution.
Based on the table, which statement is true?
27
30 sec
Q.
The table shows sources of ocean pollution.
Which action would have the biggest impact on reducing ocean pollution?
28
30 sec
Q.
A city uses the large lake on its border for drinking water. A new subdivision is being built that advertises green appliances and conservation practices. Which appliance would conserve water in the new homes?
29
30 sec
Q.
The map shows the amount of plastics in the ocean generated by different countries.
How do gyres affect plastics in the ocean?
30
30 sec
Q.
The graph shows how long it takes for some types of trash to biodegrade in the ocean.
Based on the graph, what solution could you propose?
31
30 sec
Q.
Climate change can increase ocean temperature and make ocean water more acidic, both of which affect coral reefs. The table shows the conservation status of coral reefs around the world.
Based on the data, what conclusion can you draw?
32
30 sec
Q.
Human activities can have different effects on Earth’s surface water supply. Some are beneficial and some are harmful. Think about a city that gets its drinking and household water from a large lake nearby. Review the information in the table.
The title for the column on the left should read ___________________________ to Surface Water.
33
30 sec
Q.
Human activities can have different effects on Earth’s surface water supply. Some are beneficial and some are harmful. Think about a city that gets its drinking and household water from a large lake nearby. Review the information in the table.
The title for the column on the right should read ___________________________ to Surface Water.
34
30 sec
Q.
A city replaces a large area of natural land with roads, sidewalks, and buildings. After several years, scientists observe changes in how water moves through the area.
Which claim is BEST supported by this evidence?
35
30 sec
Q.
A community relies on groundwater from an aquifer for farming and drinking water. Over time, excessive pumping causes the ground above the aquifer to sink.
Which conclusion BEST explains this observation?