compare two groups of numeric data using comparative dot plots or box plots by comparing their shapes, centers, and spreads
Track each student's skills and progress in your Mastery dashboards
Give this quiz to my class
Q 1/5
Score 0
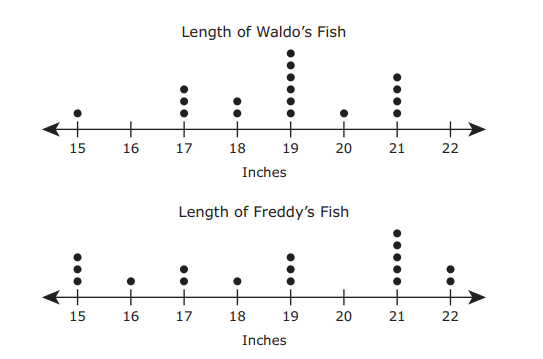
Waldo and Freddy caught fish one weekend. The dot plots show the lengths of the fish they caught. Which statement about the lengths of the fish caught by Waldo and Freddy appears to be true?
60
The data for Waldo’s fish and the data for Freddy’s fish are approximately symmetrical.
The range of the length of the fish caught by Freddy is greater than the range of the length of the fish caught by Waldo.
The data for Waldo’s fish and the data for Freddy’s fish are skewed to the right.
The median length of the fish caught by Waldo is greater than the median length of the fish caught by Freddy.
Q 2/5
Score 0
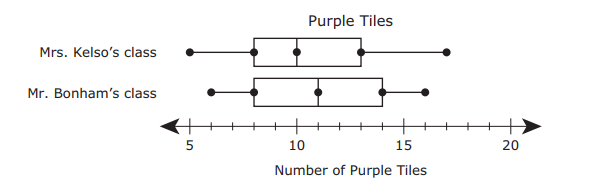
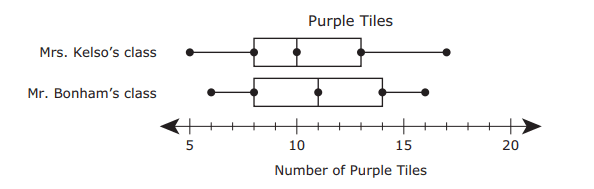
Mrs. Kelso and Mr. Bonham gave each of their students a small bag of colored tiles. The students each counted the number of purple tiles they received. The box plots display the data for both classes. Which statement is best supported by the information in the box plots?
60
The interquartile range of the data for Mrs. Kelso’s class is greater than the interquartile range of the data for Mr. Bonham’s class.
The range of the data for Mr. Bonham’s class is less than the range of the data for Mrs. Kelso’s class.
The median number of the data for Mr. Bonham’s class is less than the median number of the data for Mrs. Kelso’s class.
The data for Mrs. Kelso’s class are more symmetrical than the data for Mr. Bonham’s class.
5 questions
Q.
Waldo and Freddy caught fish one weekend. The dot plots show the lengths of the fish they caught. Which statement about the lengths of the fish caught by Waldo and Freddy appears to be true?
1
60 sec
7.12.A: Measurement and Data
Q.
Mrs. Kelso and Mr. Bonham gave each of their students a small bag of colored tiles. The students each counted the number of purple tiles they received. The box plots display the data for both classes. Which statement is best supported by the information in the box plots?
2
60 sec
7.12.A: Measurement and Data
Q.
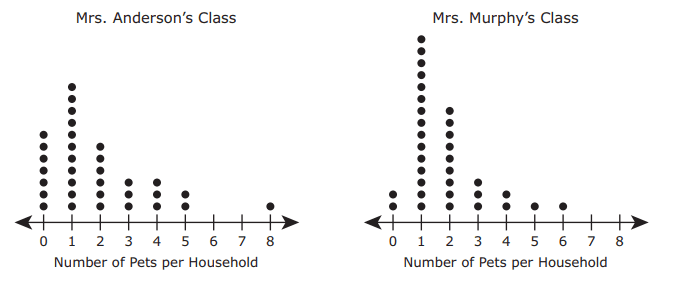
The number of pets per household for Mrs. Anderson’s class and Mrs. Murphy’s class are shown in the dot plots. Here are three statements about the number of pets per household for these two classes.
I. The range of the number of pets per household for Mrs. Murphy’s class is greater than the range of the number of pets per household for Mrs. Anderson’s class.
II. The distribution of the data is approximately symmetrical in both sets of data.
III. The mode of the number of pets per household for Mrs. Anderson’s class is equal to the mode of the number of pets per household for Mrs. Murphy’s class.
Which of these three statements appear to be true?
3
60 sec
7.12.A: Measurement and Data
Q.
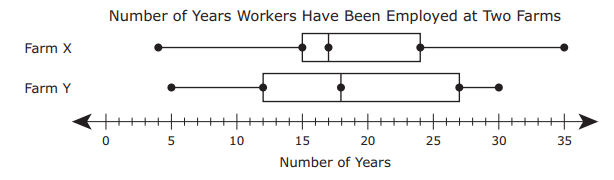
The box plots show data about the number of years that farmworkers have been employed at each of two farms. Which statement is best supported by the information in the box plots?
4
60 sec
7.12.A: Measurement and Data
Q.
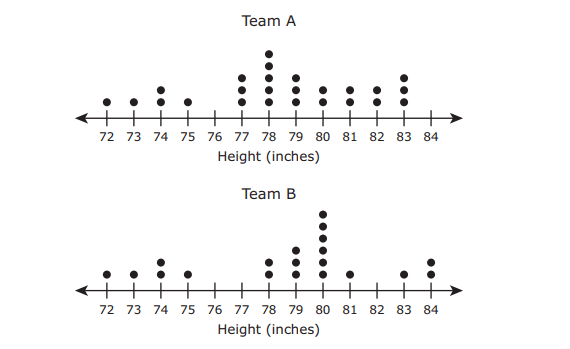
The dot plots show the heights of the players on two basketball teams. Which statement is best supported by these data?