773 Opener
Quiz by Michelle Bagley
Feel free to use or edit a copy
includes Teacher and Student dashboards
Measure skillsfrom any curriculum
Measure skills
from any curriculum
Tag the questions with any skills you have. Your dashboard will track each student's mastery of each skill.
With a free account, teachers can
- edit the questions
- save a copy for later
- start a class game
- automatically assign follow-up activities based on students’ scores
- assign as homework
- share a link with colleagues
- print as a bubble sheet


10 questions
Show answers
- Q1Find the mode: 12, 12, 13, 17, 1912131914.630s
- Q2Find the median: 12, 12, 13, 17, 1919121314.630s
- Q3Find the mean: 12, 12, 13, 17, 191914.6131230s
- Q4Find the median: 20, 20, 24, 26, 28, 303024.7252030s
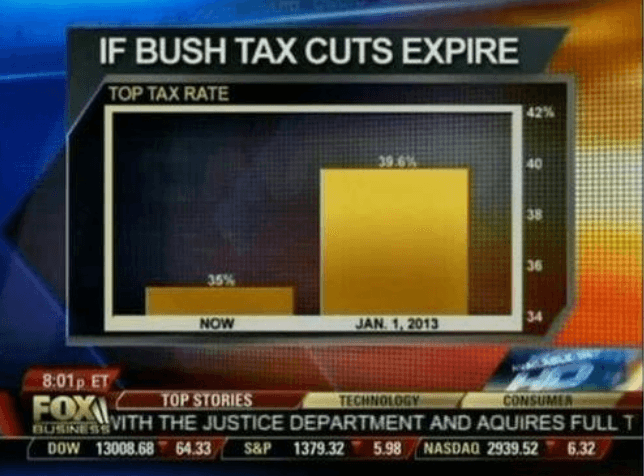
- Q5Why is this graph misleading?It is from Fox News.The scale is wrong.It doesn't have a grid behind the bars.There is no baseline on the y-axis.30s
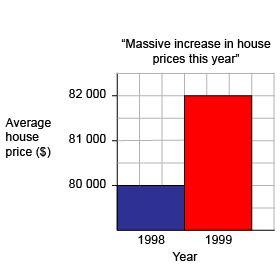
- Q6Why is this graph misleading?Zero isn't labeled.The scale is zoomed in too far.The bars are different colors.The title has quotation marks so it isn't true.30s
- Q7Why is this graph misleading?The bars are different colors.The 3D makes the bars look smaller than they are.There are no labels on the y-axis.3D graphs are always misleading.30s
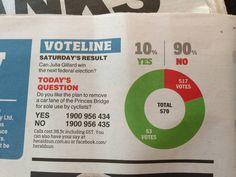
- Q8Why is this graph misleading?The center of the circle should be colored in.The labels are wrong - 10% should be the smallest value on the graph, not the largest.It looks like a Christmas wreath.The section highlighted on the graph is more like 20%.30s
- Q9What is the slope of this line? y = 4 - x-104-x30s
- Q10What is the y-intercept of this line? y = 4 - x0-x-1430s