Informally assess the degree of visual overlap of two numerical data distributions with similar variabilities, measuring the difference between the centers by expressing it as a multiple of a measure of variability.
Track each student's skills and progress in your Mastery dashboards
Give this quiz to my class
Q 1/3
Score 0
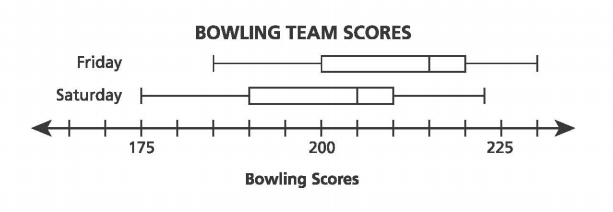
A bowling team participates in a two-day tournament and records the scores for each team member on both days. The scores for both days are represented by the box plots below. Which conclusion can be drawn from the box plots?
60
The scores on Friday have a greater interquartile range than the scores on Saturday, but both data sets have the same median.
The scores on Friday have a greater median and a greater interquartile range than the scores on Saturday.
The scores on Friday have a greater median than the scores on Saturday, but both data sets have the same interquartile range.
The scores on Friday and the scores on Saturday have the same median and interquartile range.
Q 2/3
Score 0
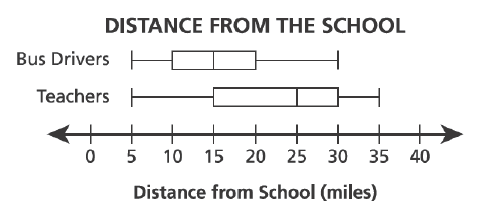
A principal gathered data about the distance, in miles, that his teachers and bus drivers live from the school. The box plots below show these data.
Based on the box plots, which statement is true?
60
The range of the distances for the teachers is twice the range of the distances for the bus drivers.
The interquartile range of the distances for the bus drivers is twice the interquartile range of the distances for the teachers.
The range of the distances for the teachers is 5 miles less than the range of the distances for the bus drivers.
The interquartile range of the distances for the bus drivers is 5 miles less than the interquartile range of the distances for the teachers.
3 questions
Q.
A bowling team participates in a two-day tournament and records the scores for each team member on both days. The scores for both days are represented by the box plots below. Which conclusion can be drawn from the box plots?
1
60 sec
7.SP.B.3
Q.
A principal gathered data about the distance, in miles, that his teachers and bus drivers live from the school. The box plots below show these data.
Based on the box plots, which statement is true?
2
60 sec
7.SP.B.3
Q.
An electronic sign that showed the speed of motorists was installed on a road. The line plots below show the speeds of some motorists before and after the sign was installed.
Based on these data, which statement is true about the speeds of motorists after the sign was installed?