Tag the questions with any skills you have. Your dashboard will track each student's mastery of each skill.
Give this quiz to my class
Q 1/30
Score 0
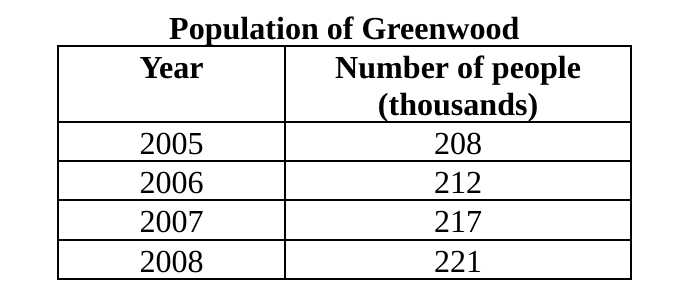
The table below lists the population of Greenwood in 4 different years.
What was the population of Greenwood in 2007?
30
217,000
217
212
212,000
Q 2/30
Score 0
Which description defines the variable in a scientific experiment?
30
any factor that can change in a controlled experiment
a range of values for a particular quantity in an experiment
a set of possible outcomes for an experiment
a question being explored by an investigation
30 questions
Q.
The table below lists the population of Greenwood in 4 different years.
What was the population of Greenwood in 2007?
1
30 sec
Q.
Which description defines the variable in a scientific experiment?
2
30 sec
Q.
Which sequence of events is a logical order of a scientific investigation?
3
30 sec
Q.
Trevor recorded the high temperature and low temperature in Miami for 5 days.
What was the high temperature in Miami on Thursday?
4
30 sec
Q.
Indira tested whether a tomato plant grew faster in part shade or full sun. The table below shows the height of each plant after 0, 10, 20, and 30 days.
What is one conclusion Indira can draw from her data?
5
30 sec
Q.
Jaime planted two seeds. She watered one seed with tap water. She watered the second seed with plant feed. She measured the height of the plant every 2 weeks. She created the graph below to show her results.
Which of these items is missing from the graph?
6
30 sec
Q.
The image shows various things that make up a pond.
Which things from the image are part of the pond ecosystem?
7
30 sec
Q.
The following image shows organisms in a certain land biome.
Which land biome is most likely shown in this image?
8
30 sec
Q.
A mangrove swamp contains many organisms living among the large roots of the mangrove trees. This food web shows some of the relationships in that ecosystem.
According to the food web, which organism is a producer in the mangrove swamp?
9
30 sec
Q.
The figure below shows a food chain that might exist in a field or meadow.
Which organism is the primary consumer in this food chain?
10
30 sec
Q.
Which of the following is an example of a biotic limiting factor in an ecosystem?
11
30 sec
Q.
Scientists studied predator-prey relationships in a habitat. The diagram below shows the feeding relationships among organisms that a scientist might find in a certain environment.
Which animal is both a predator and prey?
12
30 sec
Q.
An ecologist observed these animals in a biome.
Which biome is the ecologist studying?
13
30 sec
Q.
The diagram shows an energy pyramid.
Which type of organism would be in Section 2 of the pyramid?
14
30 sec
Q.
The diagram below shows changes occurring in an ecosystem over time.
What is happening in the diagram?
15
30 sec
Q.
The diagram shows changes to a pond ecosystem over time.
Through which of the following processes are plant communities taking over the ecosystem?
16
30 sec
Q.
The following picture shows a unicellular organism.
What type of a cell is shown?
17
30 sec
Q.
Robert Hooke was the first person to describe cells. Which of the following instruments did he use to make his observations?
18
30 sec
Q.
What is the main function of chloroplasts in a plant cell?
19
30 sec
Q.
What is the difference between eukaryotic cells and prokaryotic cells?
20
30 sec
Q.
Eugene drew the following diagram to describe the levels of structural organization of an animal’s body. He will list the cell as both the least specialized and the most numerous at the bottom of the pyramid.
Which of the following should he list in level 1 on the diagram?
21
30 sec
Q.
The diagram shows parts of the human body. These parts work together to help you digest the food you eat.
Which term best describes the entire group of parts that are labeled?
22
30 sec
Q.
The following diagram shows a common cell organelle.
What process takes place in the organelle shown?
23
30 sec
Q.
There is a connection between photosynthesis and cellular respiration. The products from one provide the raw materials for the other. This image shows the relationship between the two processes.
What products of photosynthesis are starting material for cellular respiration?
24
30 sec
Q.
When sunlight strikes a plant, the leaves capture most of that energy to use for photosynthesis. The image below shows the process of photosynthesis in action.
Which of these materials helps plants use energy from sunlight?
25
30 sec
Q.
Terrie is making a model of DNA. Which of these shapes illustrates how her model should look?
26
30 sec
Q.
The following diagram shows one type of living thing.
What type of organism is shown in the image below?
27
30 sec
Q.
The image below shows one type of living thing.
How does the organisms shown in the image obtain the nutrients it needs for life processes?
28
30 sec
Q.
What is the basic unit of life?
29
30 sec
Q.
Which of the following identifies the levels of classification in correct order?