8.4 Histogram
Quiz by Jeffrey Small
Feel free to use or edit a copy
includes Teacher and Student dashboards
Measure skillsfrom any curriculum
Tag the questions with any skills you have. Your dashboard will track each student's mastery of each skill.
- edit the questions
- save a copy for later
- start a class game
- automatically assign follow-up activities based on students’ scores
- assign as homework
- share a link with colleagues
- print as a bubble sheet
- Q 1/12Score 0
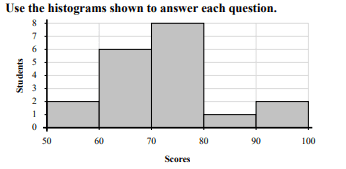
If a student scored a 94 which bar would they be added to?
2970-80
60-70
80-90
90-100


- Q1
If a student scored a 94 which bar would they be added to?
70-80
60-70
80-90
90-100
30s - Q2
How many students are represented in this histogram?
17
15
21
19
30s - Q3
How many students scored between a 60 and 70?
0
8
6
7
30s - Q4
Most students scored between a _____ and _____.
80 and 90
70 and 90
70 and 80
50 and 60
30s - Q5
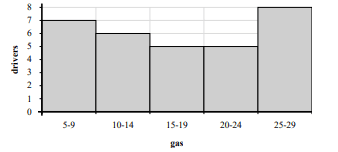
Most drivers purchased between _____ and _____ gallons
10 and 14
5 and 9
25 and 29
20 and 24
30s - Q6
How many drivers are represented in this histogram?
29
30
32
31
30s - Q7
If a driver purchased 17 gallons which bar would they be added to?
15-19
15-24
25-29
5-9
30s - Q8
How many drivers purchased between 5 and 10 gallons?
7
6
2
8
30s - Q9
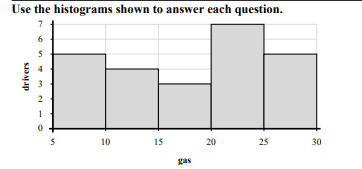
Most drivers purchased between _____ and _____ gallons.
10 and 15
5 and 10
20 and 25
20 and 30
30s - Q10
How many drivers purchased between 15 and 20 gallons?
3
7
4
8
30s - Q11
How many drivers are represented in this histogram?
23
22
20
24
30s - Q12
If a driver purchased 27 gallons which bar would they be added to?
6
3
7
5
30s