use data from a table or graph to determine the rate of change or slope and y-intercept in mathematical and real-world problems
Track each student's skills and progress in your Mastery dashboards
Give this quiz to my class
Q 1/6
Score 0
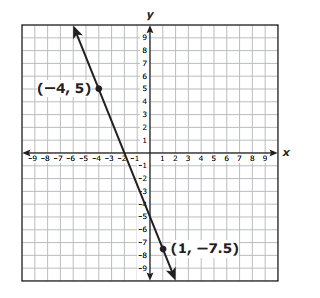
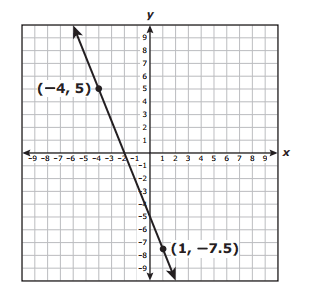
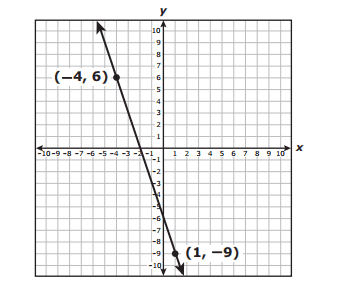
The graph of a linear function is shown on the coordinate grid. What is the y-intercept of the graph of the linear function? Be sure to use the correct place value.
60
Users enter free text
Q 2/6
Score 0
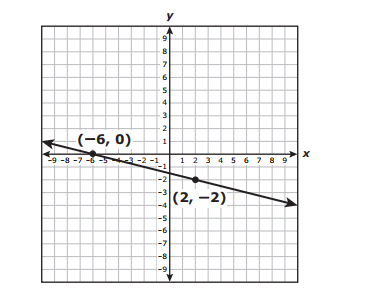
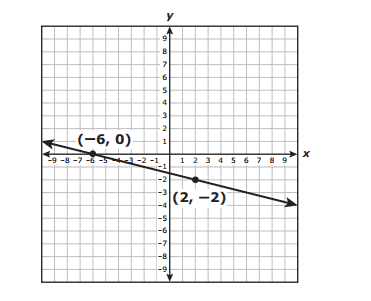
What are the slope and the y-intercept of the graph of the linear function shown on the grid?
60
Slope= -1/4, y-intercept =-1.5
Slope = -4, y-intercept = -1.5
Slope = 4, y-intercept = -6
Slope= 1/4 = , y-intercept = -6
6 questions
Q.
The graph of a linear function is shown on the coordinate grid. What is the y-intercept of the graph of the linear function? Be sure to use the correct place value.
1
60 sec
8.4.C: Proportionality
Q.
What are the slope and the y-intercept of the graph of the linear function shown on the grid?
2
60 sec
8.4.C: Proportionality
Q.
The graph of a linear function is shown on the coordinate grid. What is the y-intercept of the graph of the linear function? Be sure to use the correct place value.
3
60 sec
8.4.C: Proportionality
Q.
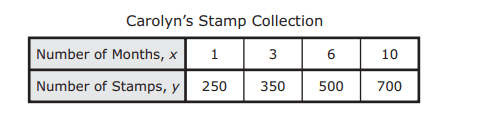
Carolyn will buy the same number of stamps every month to add to a stamp collection her grandfather gave her. The table shows the number of stamps Carolyn will have at the end of x months. How many stamps was Carolyn given, and how many stamps will she buy every month?
4
60 sec
8.4.C: Proportionality
Q.
The table shows the number of gallons of gasoline in a car’s gas tank after the car has been driven x miles. When these data are graphed on a coordinate grid, the points all lie on the same line. What are the slope and y-intercept of this line?
5
60 sec
8.4.C: Proportionality
Q.
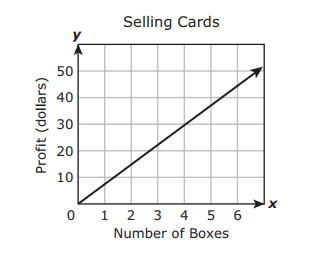
Emily sells greeting cards. The graph models the linear relationship between the number of boxes of cards she sells and her profit. Which of these best describes the profit Emily makes from selling these cards?