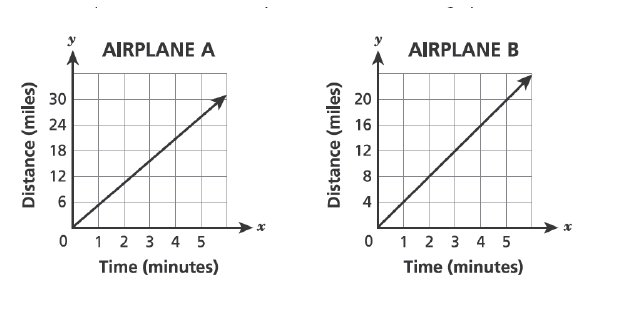
Graph proportional relationships, interpreting the unit rate as the slope of the graph. Compare two different proportional relationships represented in different ways. For example, compare a distance-time graph to a distance-time equation to determine which of two moving objects has greater speed.
Track each student's skills and progress in your Mastery dashboards
Give this quiz to my class
Q 1/7
Score 0
60
Q 2/7
Score 0
60
7 questions
Q.
1
60 sec
8.EE.B.5
Q.
2
60 sec
8.EE.B.5
Q.
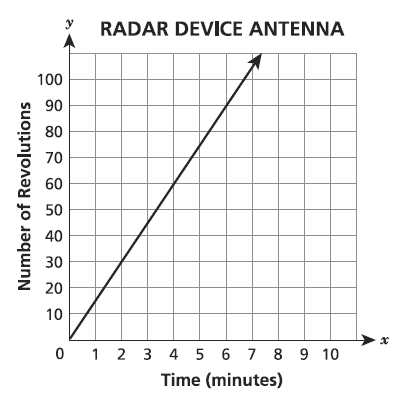
A radar device has an antenna that revolves at a constant rat e. The graph shows the number of revolutions the device will make over time.
Which table shows the data for an antenna that revolves at exactly twice the rate of the antenna described in the graph?