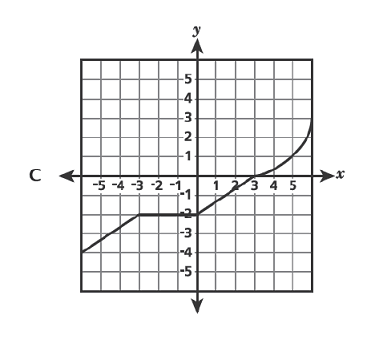
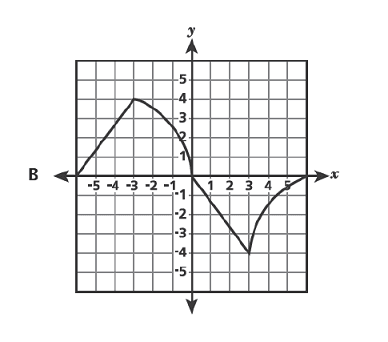
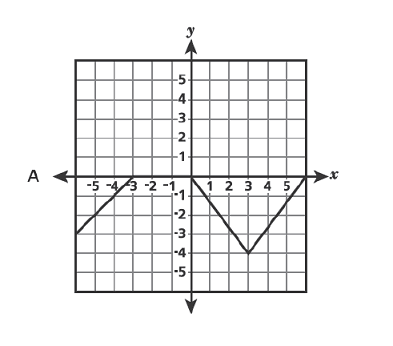
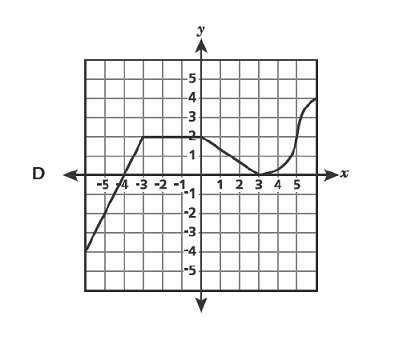
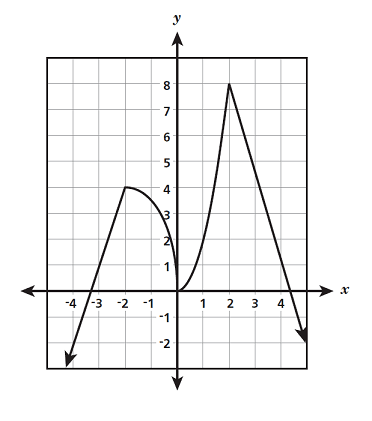
Describe qualitatively the functional relationship between two quantities by analyzing a graph (e.g., where the function is increasing or decreasing, linear or nonlinear). Sketch a graph that exhibits the qualitative features of a function that has been described verbally.
Track each student's skills and progress in your Mastery dashboards
Give this quiz to my class
Q 1/5
Score 0
60
Q 2/5
Score 0
60
5 questions
Q.
1
60 sec
8.F.B.5
Q.
2
60 sec
8.F.B.5
Q.
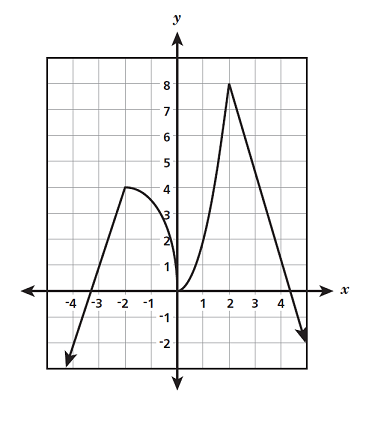
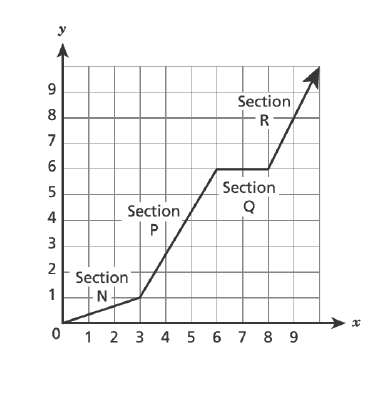
The graph of a function is shown below.
Which statement is TRUE about a section of the graph?