Feel free to use or edit a copy
includes Teacher and Student dashboards
Measures 1 skill from
Measures 1 skill from
Track each student's skills and progress in your Mastery dashboards
With a free account, teachers can
- edit the questions
- save a copy for later
- start a class game
- automatically assign follow-up activities based on students’ scores
- assign as homework
- share a link with colleagues
- print as a bubble sheet
5 questions
Show answers
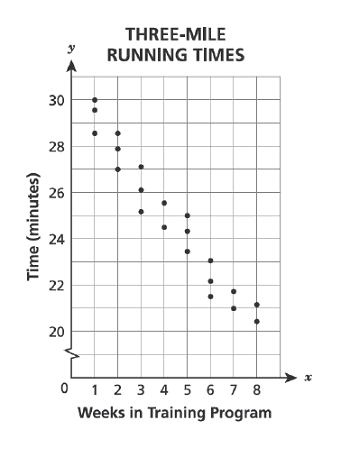
- Q1As part of a training program for a triathlon, Marcie completes a three-mile run a few times each week. The scatter plot below shows the times in which Marcie completes this run for each week that she has been in the training program. Based on these data, which statement BEST describes the relationship between the number of weeks Marcie has been in the training program and her running times?There is a negative linear association with one outlier.There is a positive linear association with one outlier.There is a negative linear association with no outliers.There is a positive linear association with no outliers.60s8.SP.A.1
- Q2The scatter plot below shows the average points scored per game by players of different ages in an adult basketball league. Which statement BEST describes the association between a player's age, in years, and the average points scored per game?There is a negative linear association and one outlier.There is no association.There is a positive linear association and one outlier.There is a nonlinear association.60s8.SP.A.1
- Q3The scatter plot below shows the average number of customers who visit a food truck per day, depending on the number of days the food truck stays in the same location. Which statement BEST describes the association between the number of days the food truck is in the same location and the number of customers who visit the food truck per day?There is a positive linear association.There is a nonlinear association.There is a negative linear association.There is no association.60s8.SP.A.1
- Q4The scatter plot below shows the relationship between the outside temperature and the number of cups of hot chocolate sold at an event. Which statement describes the data?There is a nonlinear association between the outside temperature, in degrees Fahrenheit, and the number of cups of hot chocolate sold.There is a positive linear association between the outside temperature, in degrees Fahrenheit, and the number of cups of hot chocolate sold.There is no association between the outside temperature, in degrees Fahrenheit, and the number of cups of hot chocolate sold.There is a negative linear association between the outside temperature, in degrees Fahrenheit, and the number of cups of hot chocolate sold.60s8.SP.A.1
- Q5The scatter plot below shows the points scored and the points allowed by the Bulldogs football team for several games. Which association (correlation) best describes the data?negative association (correlation)no association (correlation)positive association (correlation)nonlinear association (correlation)60s8.SP.A.1

