Tag the questions with any skills you have. Your dashboard will track each student's mastery of each skill.
Give this quiz to my class
Q 1/21
Score 0
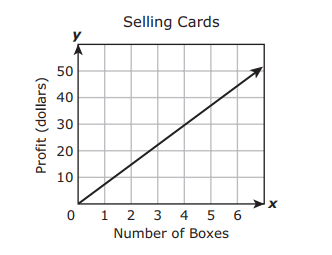
Emily sells greeting cards. The graph models the linear relationship between the number of boxes of cards she sells and her profit. Which of these best describes the profit Emily makes from selling these cards?
120
$4.00 per 30 boxes
$10.00 per box
$7.50 per box
$3.00 per 4 boxes
Q 2/21
Score 0
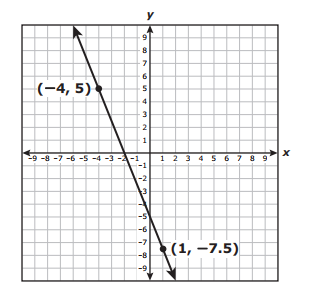
The graph of a linear function is shown on the coordinate grid. What is the y-intercept of the graph of the linear function? Be sure to use the correct place value.
120
Users enter free text
21 questions
Q.
Emily sells greeting cards. The graph models the linear relationship between the number of boxes of cards she sells and her profit. Which of these best describes the profit Emily makes from selling these cards?
1
120 sec
Q.
The graph of a linear function is shown on the coordinate grid. What is the y-intercept of the graph of the linear function? Be sure to use the correct place value.
2
120 sec
Q.
What are the slope and the y-intercept of the graph of the linear function shown on the grid?
3
120 sec
Q.
Carolyn will buy the same number of stamps every month to add to a stamp collection her grandfather gave her. The table shows the number of stamps Carolyn will have at the end of x months. How many stamps was Carolyn given, and how many stamps will she buy every month?
4
120 sec
Q.
Judy can decorate 3 cakes in 5 hours. Which graph has a slope that best represents the number of cakes per hour Judy can decorate?
5
120 sec
Q.
An aquarium is being filled with water. The graph shows the height of the water over time as the aquarium is being filled. Which statement best describes the rate of change for this situation?
6
120 sec
Q.
Which table contains only corresponding x-values and y-values where the value of y is 3 more than the quotient of x and 2?
7
120 sec
Q.
The approximate volume in milliliters, m, for a volume of f fluid ounces is equal to 29.57 times the value of f. Which table represents this relationship?
8
120 sec
Q.
Which scatterplot suggests a linear relationship between x and y?
9
120 sec
Q.
10
120 sec
Q.
The number of gift baskets Nikki can make varies directly with the amount of time she spends making the baskets. She can make 4 baskets in 1/2 hour. How many baskets can Nikki make in 5 hours? Be sure to use the correct place value.
11
120 sec
Q.
Which graph shows a proportional relationship between x and y?
12
120 sec
Q.
Which graph shows a non-proportional linear relationship between x and y?
13
120 sec
Q.
Which representation does not show y as a function of x?
14
120 sec
Q.
Which set of ordered pairs represents y as a function of x?
15
120 sec
Q.
Which statement describes the mapping?
16
120 sec
Q.
Which graph does NOT represent y as a function of x?
17
120 sec
Q.
Which situation represents a proportional relationship?
18
120 sec
Q.
Mr. Leonard is renting a car for one day. The table below shows the total amount he will be charged for the car based on the number of miles he drives. Which equation best represents c, the number of dollars Mr. Leonard should be charged for driving m miles?
19
120 sec
Q.
20
120 sec
Q.
Melissa is saving $25 that she earned for washing her mom’s car. She earns $10 every week for doing chores, which she also saves. Which function can be used to find t, the amount of money Melissa will have saved at the end of n weeks of doing chores?