A.1.D Mathematical Communications
Quiz by Algebra I - Texas Education Agency
High School
Math (Archived)
Texas Essential Knowledge and Skills (TEKS)
Feel free to use or edit a copy
includes Teacher and Student dashboards
Measures 1 skill from
Measures 1 skill from
Track each student's skills and progress in your Mastery dashboards
With a free account, teachers can
- edit the questions
- save a copy for later
- start a class game
- automatically assign follow-up activities based on students’ scores
- assign as homework
- share a link with colleagues
- print as a bubble sheet
- Q 1/7Score 029


7 questions
Show answers
- Q160sA.1.D: Mathematical Communications
- Q260sA.1.D: Mathematical Communications
- Q360sA.1.D: Mathematical Communications
- Q4Which graph represents the inequality −2x + 3y > 12?60sA.1.D: Mathematical Communications
- Q5The number of possible pairings of 2 objects selected from a set of x objects can be modeled by p(x) = 0.5x(x − 1). Which table shows this quadratic relationship?60sA.1.D: Mathematical Communications
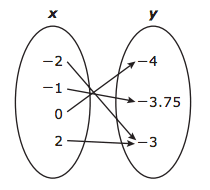
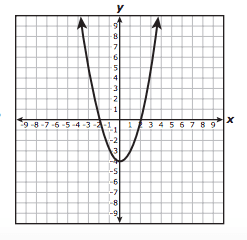
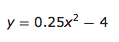
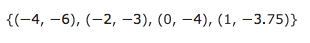
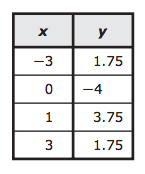
- Q6The mapping below represents y as a quadratic function of x. Which representation shows the same relationship between x and y?45sA.1.D: Mathematical Communications
- Q7Which graph represents the inequality −2x + 7y ≤ 112?60sA.1.D: Mathematical Communications