Write linear equations in two variables given a table of values, a graph, and a verbal description.
Track each student's skills and progress in your Mastery dashboards
Give this quiz to my class
Q 1/8
Score 0
60
Q 2/8
Score 0
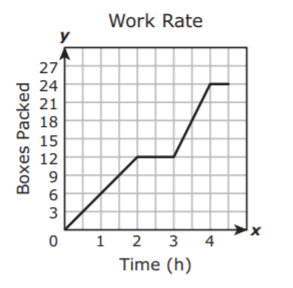
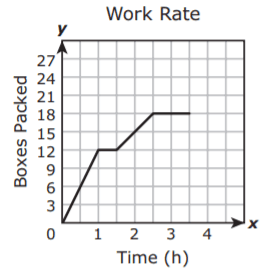
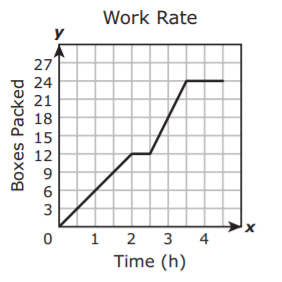
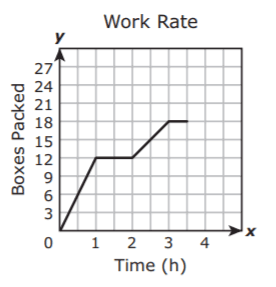
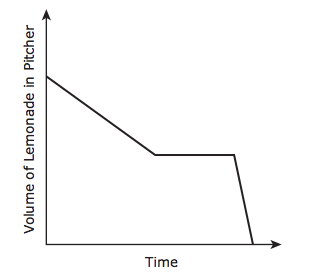
A factory worker packed 12 boxes at a constant rate, took a 30-minute break, and then continued packing boxes at twice the rate before the break. The worker then spent 1 hour cleaning the work area. Which graph models this situation?
60
8 questions
Q.
1
60 sec
A.2.C: Linear Equations (2)
Q.
A factory worker packed 12 boxes at a constant rate, took a 30-minute break, and then continued packing boxes at twice the rate before the break. The worker then spent 1 hour cleaning the work area. Which graph models this situation?
2
60 sec
A.2.C: Linear Equations (2)
Q.
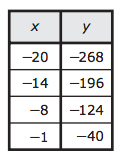
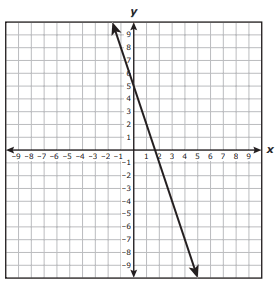
The table represents some points on the graph of a linear function. Which function represents the same relationship?