Write, with and without technology, linear functions that provide a reasonable fit to data to estimate solutions and make predictions for real-world problems.
Track each student's skills and progress in your Mastery dashboards
Loading...
Loading...
Loading...
Q 1/3
Score 0
60
Users enter free text
Q 2/3
Score 0
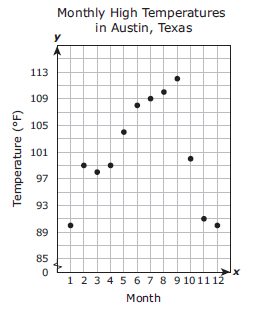
The scatterplot shows the monthly high temperatures for Austin, Texas, in degrees Fahrenheit over a 12-month period. Which function best models the data from Month 1 to Month 9?
60
y = -1.6x + 111
y = 2.5x + 90
y = -3.3x + 130
y= 2.5x + 90
Give this quiz to my class
3 questions
Q.
1
60 sec
A.4.C: Real-World Linear Functions
Q.
The scatterplot shows the monthly high temperatures for Austin, Texas, in degrees Fahrenheit over a 12-month period. Which function best models the data from Month 1 to Month 9?
2
60 sec
A.4.C: Real-World Linear Functions
Q.
A zookeeper recorded the feeding schedule for a baby rhinoceros for 20 weeks. The table and scatterplot show the percentage of the baby rhinoceros's body mass that was used to determine the amount of food given at each feeding as a linear function of its age in weeks.
What is the best prediction of the percentage of the baby rhinoceros's body mass that should be used to determine the amount of food given at each feeding when it is 25 weeks old?