Write equations of quadratic functions given the vertex and another point on the graph, write the equation in vertex form (f(x) = a(x - h)2+ k), and rewrite the equation from vertex form to standard form (f(x) = ax2+ bx + c).
Track each student's skills and progress in your Mastery dashboards
Give this quiz to my class
Q 1/13
Score 0
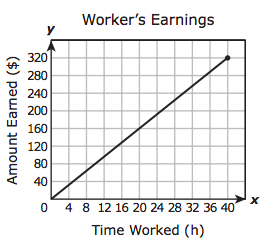
The graph below shows the relationship between the number of dollars a worker earns and the number of hours worked. What does the slope of the graph represent?
60
The number of hours of work it takes to earn $320
The number of hours worked per dollar earned
The amount of money earned per hour
The amount earned for 40 hours of work
Q 2/13
Score 0
60
Users enter free text
13 questions
Q.
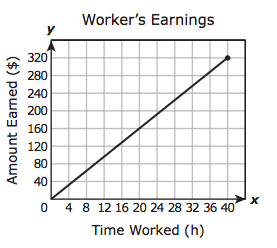
The graph below shows the relationship between the number of dollars a worker earns and the number of hours worked. What does the slope of the graph represent?
1
60 sec
A.6.B: Quadratic Functions On Graphs
Q.
2
60 sec
A.6.B: Quadratic Functions On Graphs
Q.
3
60 sec
A.6.B: Quadratic Functions On Graphs
Q.
4
60 sec
A.6.B: Quadratic Functions On Graphs
Q.
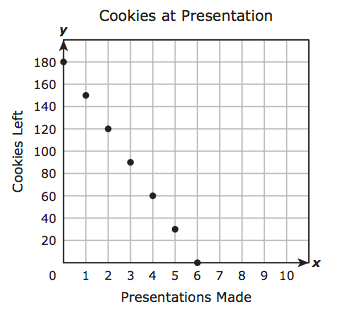
The graph shows the relationship between the number of cookies a presenter at a convention had left to give away and the number of presentations she had made. What does the x-intercept of the graph represent?
5
60 sec
A.6.B: Quadratic Functions On Graphs
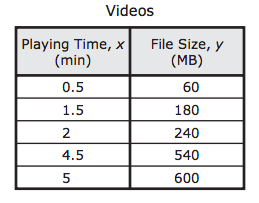
Q.
The table shows the playing time in minutes of high-definition videos and the file size of these videos in megabytes (MB). What does the slope of the graph of this situation represent?
6
60 sec
A.6.B: Quadratic Functions On Graphs
Q.
What is the equation of the line that has a slope of 0 and passes through the point (6, −8)?
7
60 sec
A.6.B: Quadratic Functions On Graphs
Q.
The function y = 6 + 1.25x can be used to find the cost of joining an online music club and buying x songs from the website. Based on this information, which statement about the graph of this situation is true?
8
60 sec
A.6.B: Quadratic Functions On Graphs
Q.
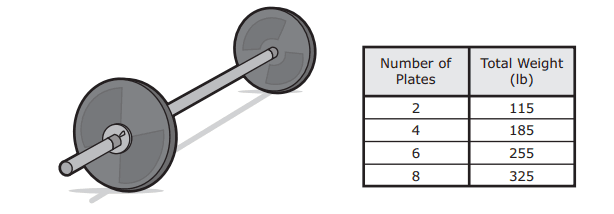
9
60 sec
A.6.B: Quadratic Functions On Graphs
Q.
10
60 sec
A.6.B: Quadratic Functions On Graphs
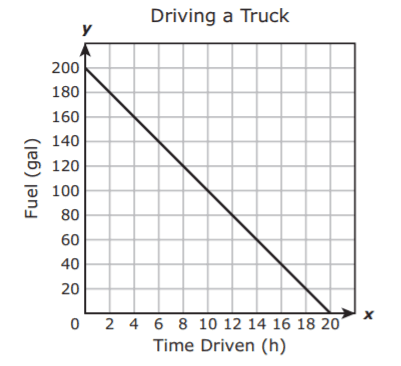
Q.
The graph below shows the relationship between the number of gallons of fuel remaining in a truck and the number of hours the truck has been driven. What does the x-intercept of the graph represent?