placeholder image to represent content

A.6.C Quadratic Functions Solutions & Graphs

Quiz by Texas Education Agency

High School
Mathematics
Texas Essential Knowledge and Skills (TEKS)

Feel free to use or edit a copy

includes Teacher and Student dashboards

Measures 1 skill from
High School
Mathematics
Texas Essential Knowledge and Skills (TEKS)

A.6.C: Quadratic Functions Solutions & Graphs

Track each student's skills and progress in your Mastery dashboards

With a free account, teachers can
  • edit the questions
  • save a copy for later
  • start a class game
  • automatically assign follow-up activities based on students’ scores
  • assign as homework
  • share a link with colleagues
  • print as a bubble sheet

Our brand new solo games combine with your quiz, on the same screen

Correct quiz answers unlock more play!

New Quizalize solo game modes
11 questions
Show answers
  • Q1
    Question Image
    60s
    A.6.C: Quadratic Functions Solutions & Graphs
  • Q2
    60s
    A.6.C: Quadratic Functions Solutions & Graphs
  • Q3
    60s
    A.6.C: Quadratic Functions Solutions & Graphs
  • Q4
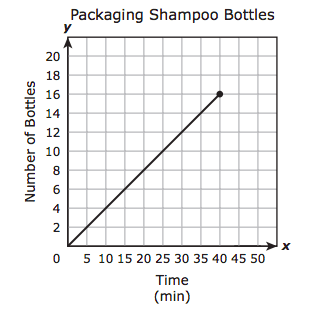
    The graph shows the time it took a worker to package 16 bottles of shampoo. The next day two workers packaged twice the number of bottles of shampoo in the same amount of time. If this new relationship is graphed on the same coordinate grid, which statement is true?
    Question Image
    The new graph would have a y-intercept at 8.
    The new graph would be steeper than the original graph.
    The new graph would have a y-intercept at 80.
    The new graph would be less steep than the original graph.
    60s
    A.6.C: Quadratic Functions Solutions & Graphs
  • Q5
    60s
    A.6.C: Quadratic Functions Solutions & Graphs
  • Q6
    Answer Image
    Answer Image
    Answer Image
    Answer Image
    60s
    A.6.C: Quadratic Functions Solutions & Graphs
  • Q7
    60s
    A.6.C: Quadratic Functions Solutions & Graphs
  • Q8
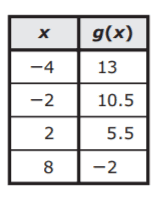
    The table represents some points on the graph of linear function g. The graph of g was translated down 10 units to create the graph of function h. Which statement comparing the graphs of g and h is true?
    Question Image
    The graph of g is less steep than the graph of h.
    The y-intercept of the graph of g is 10 units above the y-intercept of the graph of h.
    The x-intercept of the graph of g is 10 units to the right of the x-intercept of the graph of h.
    The graph of g is steeper than the graph of h.
    60s
    A.6.C: Quadratic Functions Solutions & Graphs
  • Q9
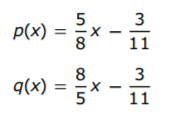
    Two functions are given below. How does the graph of p compare with the graph of q?
    Question Image
    The graph of p is steeper than the graph of q.
    The graph of p has a different y-intercept than the graph of q.
    The graph of p is less steep than the graph of q.
    The graph of p is parallel to the graph of q.
    60s
    A.6.C: Quadratic Functions Solutions & Graphs
  • Q10
    Question Image
    60s
    A.6.C: Quadratic Functions Solutions & Graphs
  • Q11
    Question Image
    60s
    A.6.C: Quadratic Functions Solutions & Graphs

Teachers give this quiz to your class