Write exponential functions in the form f(x) = abx (where b is a rational number) to describe problems arising from mathematical and real-world situations, including growth and decay.
Track each student's skills and progress in your Mastery dashboards
Give this quiz to my class
Q 1/9
Score 0
60
Q 2/9
Score 0
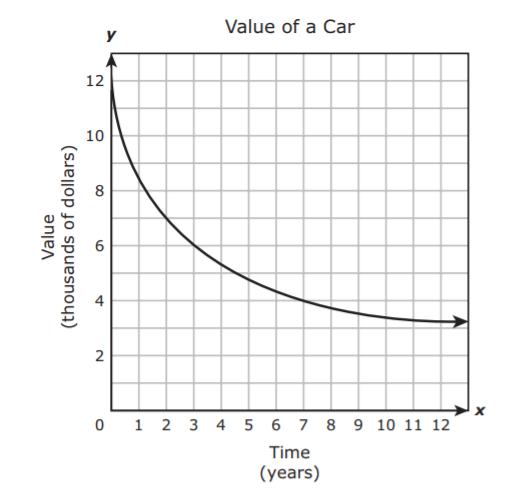
The graph below shows the change in the value of a car over several years. Based on the information in the graph, which conclusion appears to be true?
60
The car lost about one-quarter of its value every year.
The car lost more of its value between years 9 and 10 than between years 1 and 2.
The car lost about one-half of its value every 3 years.
The car lost less of its value between years 9 and 10 than between years 1 and 2.
9 questions
Q.
1
60 sec
A.9.C: Growth & Decay Of Exponential Functions
Q.
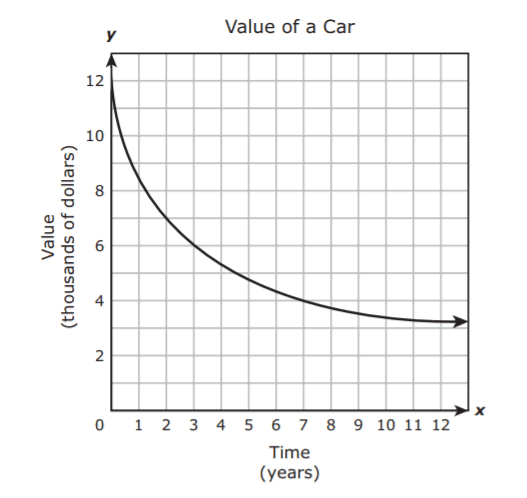
The graph below shows the change in the value of a car over several years. Based on the information in the graph, which conclusion appears to be true?