A.9.D Graph Exponential Functions
Quiz by Algebra I - Texas Education Agency
High School
Math (Archived)
Texas Essential Knowledge and Skills (TEKS)
Feel free to use or edit a copy
includes Teacher and Student dashboards
Measures 1 skill from
Measures 1 skill from
Track each student's skills and progress in your Mastery dashboards
With a free account, teachers can
- edit the questions
- save a copy for later
- start a class game
- automatically assign follow-up activities based on students’ scores
- assign as homework
- share a link with colleagues
- print as a bubble sheet


12 questions
Show answers
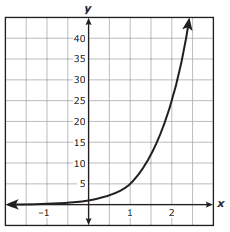
- Q145sA.9.D: Graph Exponential Functions
- Q260sA.9.D: Graph Exponential Functions
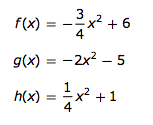
- Q3Which statement about the quadratic functions below is false?The graphs of two of these functions have a minimum point.The graphs of all these functions have the same axis of symmetry.The graphs of two of these functions do not cross the x-axis.The graphs of all these functions have different y-intercepts.60sA.9.D: Graph Exponential Functions
- Q460sA.9.D: Graph Exponential Functions
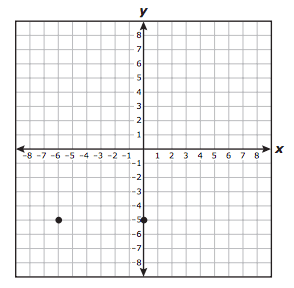
- Q5Points (3, 2) and (7, 2) are on the graphs of both quadratic functions f and g. The graph of f opens downward, and the graph of g opens upward. Which of these statements are true?I onlyII onlyII and IVI and III60sA.9.D: Graph Exponential Functions
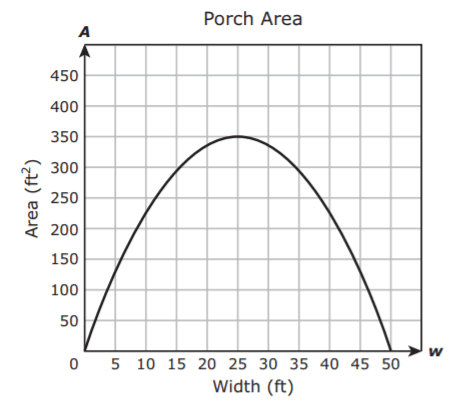
- Q6The graph models A, the area in square feet of a rectangular porch with a length that is 0.56w less than 28 ft given a width of w feet. Based on the graph, what is the width in feet of the porch with the greatest area?175 ft50 ft25 ft350 ft60sA.9.D: Graph Exponential Functions
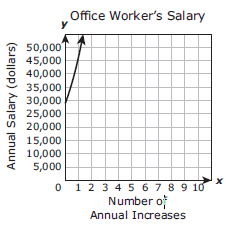
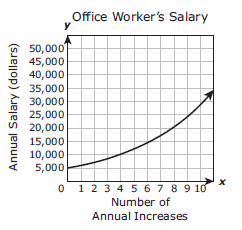
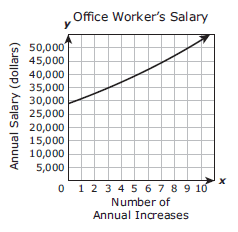
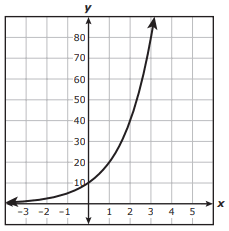
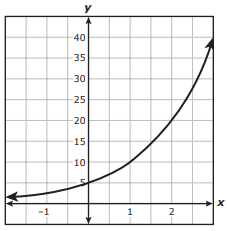
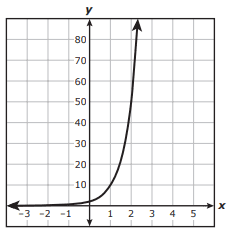
- Q7The starting annual salary for an office worker at a company is $29,000. If the company awards an annual increase of 6.2%, which graph models this situation after the office worker receives x annual increases?60sA.9.D: Graph Exponential Functions
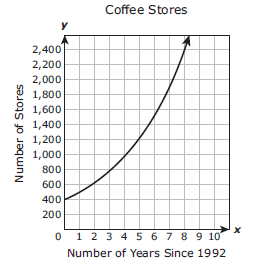
- Q8The number of stores opened by a coffee company can be modeled by the exponential function graphed on the grid, where x is the number of years since 1992. Based on the graph, which statement does not appear to be true?The coffee company had opened 400 stores by the end of 1992.Every year the number of stores the coffee company opened increased by 25%.Since 1992 the coffee company has opened 250 stores each year.The coffee company opened 100 stores in one year.60sA.9.D: Graph Exponential Functions
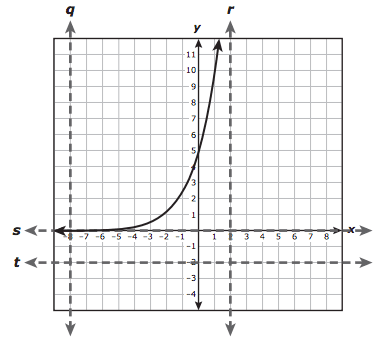
- Q9The graph of an exponential function is shown on the grid. Which dashed line is an asymptote for the graph?Line rLine tLine sLine q60sA.9.D: Graph Exponential Functions
- Q1060sA.9.D: Graph Exponential Functions
- Q1160sA.9.D: Graph Exponential Functions
- Q1260sA.9.D: Graph Exponential Functions