The student applies the mathematical process standards when using graphs of linear functions, key features, and related transformations to represent in multiple ways and solve, with and without technology, equations, inequalities, and systems of equations.
Write a formula for the nth term of arithmetic and geometric sequences, given the value of several of their terms
Track each student's skills and progress in your Mastery dashboards
Give this quiz to my class
Q 1/13
Score 0
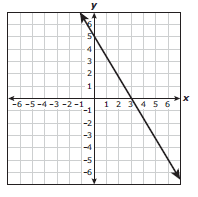
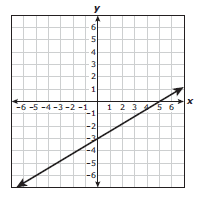
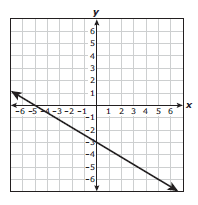
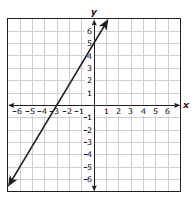
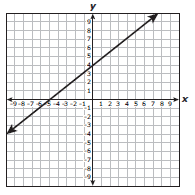
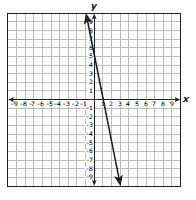
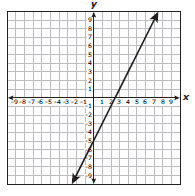
Which graph represents -3x + 5y = - 15?
120
Q 2/13
Score 0
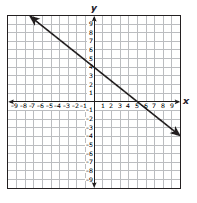
Which graph shows a line with an x-intercept of -5?
120
13 questions
Q.
Which graph represents -3x + 5y = - 15?
1
120 sec
111.39.C.3
Q.
Which graph shows a line with an x-intercept of -5?
2
120 sec
111.39.C.3
Q.
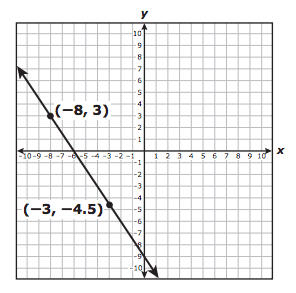
What is the zero of the graph shown
3
120 sec
111.39.C.3
Q.
Which line shows an x-intercept of −5 and a y-intercept of 3?
4
120 sec
111.39.C.3
Q.
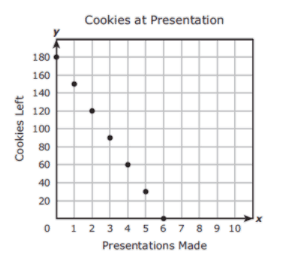
The graph shows the relationship between the number of cookies a presenter at a convention had left to give away and the number of presentations she had made.
What does the x-intercept of the graph represent?