Tag the questions with any skills you have. Your dashboard will track each student's mastery of each skill.
Give this quiz to my class
Q 1/10
Score 0
What type of graph is used to show the relationship between two quantitative varialbes
120
scatterplot
Q 2/10
Score 0
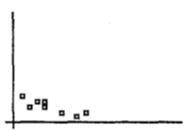
The correlation r for the data in this scatterplot is
120
near 1
near -.5
near 0
near -1
10 questions
Q.
What type of graph is used to show the relationship between two quantitative varialbes
1
120 sec
Q.
The correlation r for the data in this scatterplot is
2
120 sec
Q.
In the scatterplot , if each x-value were decreased by one unit and the y-values remained the same, then the correlation r would
3
120 sec
Q.
In regression, the residuals are which of the following?
4
120 sec
Q.
What does the square of the correlation measure?
5
120 sec
Q.
Which of the following statements are true?
I. Correlation and regression require explanatory and response variables.
II. Scatterplots require that both variables be quantitative.
III. Every LSRL passes through the mean of x and y
6
120 sec
Q.
A local community college announces the correlation between college entrance exam grades and
scholastic achievement was found to be -1.08. On the basis of this, you would tell the college that
7
120 sec
Q.
8
120 sec
Q.
Suppose we fit the LSRL to a set of data. What is true if a plot of the residuals shows a curved
pattern?
9
120 sec
Q.
The following is / are resistant to drastic, unusual data: