Loading...
AQA Micro AS Paper 1 - Specimen
Quiz by Koen De Mulder
Tag the questions with any skills you have. Your dashboard will track each student's mastery of each skill.
The diagram shows two demand curves for frozen peas.
The diagram shows that, all other things being equal, the shift of the demand curve for frozen peas from D1 to D2 can result from
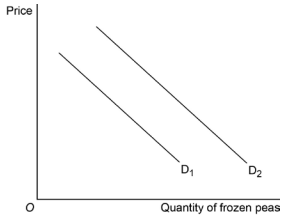
an increase in the price of frozen peas.
a change in consumer preference for frozen peas.
a decrease in the price of a substitute for frozen peas.
an increase in the quantity of frozen peas supplied.
Diseconomies of scale occur when
The diagram shows two demand curves for frozen peas.
The diagram shows that, all other things being equal, the shift of the demand curve for frozen peas from D1 to D2 can result from

A key distinction between merit goods and demerit goods is that
A profit-maximising firm with market power is most likely to use that market power to
If demand for a product is unit elastic, for a given percentage increase in price, total revenue will
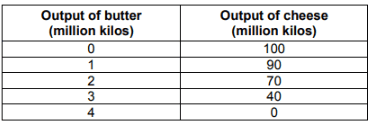
The table shows the production possibilities for a firm producing butter and cheese.
It can be concluded from the table that, as production of butter increases, the opportunity cost of such production, in terms of cheese
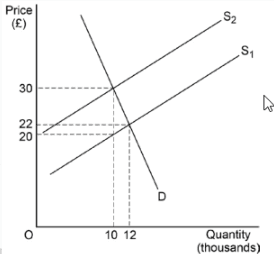
The diagram shows the market demand and supply curves and the market equilibrium both before and after an indirect tax is applied to a good.
According to the diagram, the revenue the government collects from this tax is
Which one of the following is most likely to make a market more competitive?
A supermarket reduces the price of tins of biscuits from £4 to £3 per tin. Subsequently, the sales increase from 200 to 300 tins of biscuits per day.
The price elasticity of demand is
Which one of the following statements about money and specialisation is correct?
The table shows the value of income elasticities of demand for three goods, X, Y and Z, over a period of time.
From the data in the table, it may be concluded that an increase in consumer income would lead to

Which one of the following is the reason why public goods are supplied by the government?
Price elasticity of supply in an industry is likely to be elastic when
Which one of these is a function of the market mechanism?
The table shows how the total output of a factory changes as the number of workers employed changes.
Referring to the data in the table, what happens to labour productivity as the number of workers increases from 100 to 500? Labour productivity
Which one of the following is a positive economic statement?
The diagram shows the demand and supply curves for an energy company which sells electricity produced using renewable sources.
Which one of the following will shift the market equilibrium position from X to Y?

The basic model of monopoly suggests inefficiency and a misallocation of resources. This could be explained by monopolists
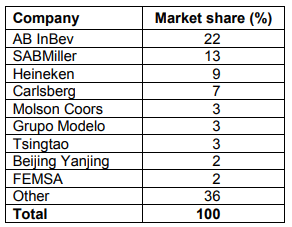
The table shows the world beer market share (%) by volume for brewing companies.
From the data in the table, what is the eight-firm concentration ratio?
In the table, all other things being equal, which combination of factors A, B, C or D is most likely to enable a firm in a competitive market to increase its market share?
