Loading...
AS Econ - Micro - Edexcel (Jan 13-Jun 14)
Quiz by Koen De Mulder
Tag the questions with any skills you have. Your dashboard will track each student's mastery of each skill.
What does the change from WU to WZ show?
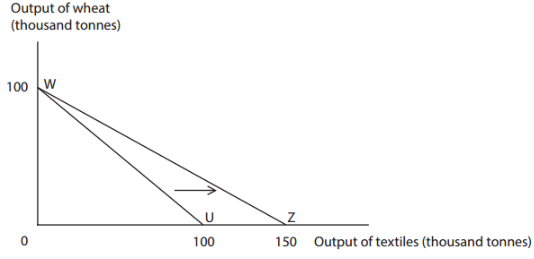
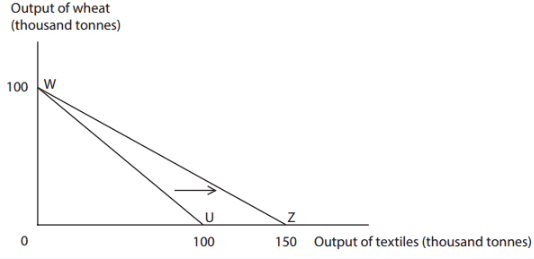
Increased efficiency in the production of textiles
A decrease in the production of wheat
Increased demand for textiles
A decrease in the opportunity cost of producing wheat
In Australia the number of motor vehicles produced on average by each worker per year increased from 10 to 18 between 1986 and 2011. The most likely cause of this trend is an increase in the
What does the change from WU to WZ show?
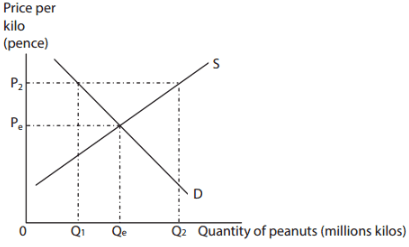
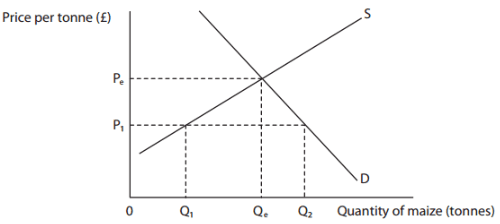
The diagram shows a competitive market for peanuts. Assuming the current price is P2, the most likely outcome is the
Which one of the following pairs of products is most likely to have a negative cross price elasticity of demand between them?
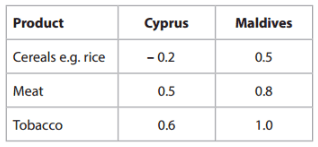
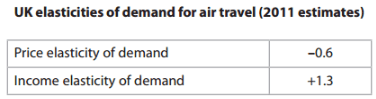
Estimates of income elasticity of demand for selected items in Cyprus and the Maldives. It may be deduced from the data in the table that
A decrease in the production costs of microchips through the development of new technology is most likely to

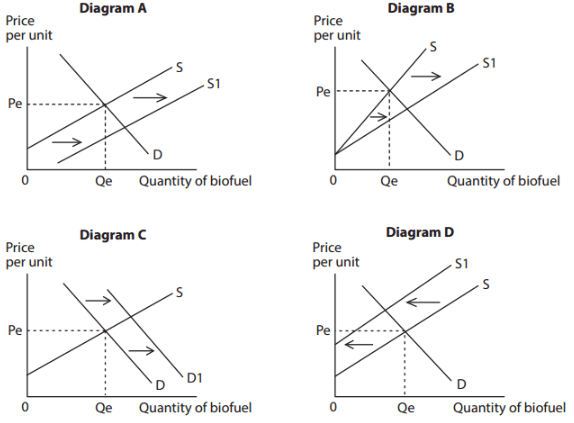
Which diagram, A, B, C and D, best illustrates the effects of a subsidy per unit of output?
In October 2013, the National Minimum Wage (NMW) was increased from £6.19 to £6.31 per hour for adult workers. The most likely effect on the market for experienced bricklayers is

Opportunity cost arises because
The most likely consequence of an increase in the division of labour in the construction of new houses is an increase in
A possible cause of a fall in the price of tea is
Market research estimates that a 100% increase in the price of coffee in Uganda leads to a 33% increase in the quantity supplied. This information suggests the supply of coffee in Uganda is
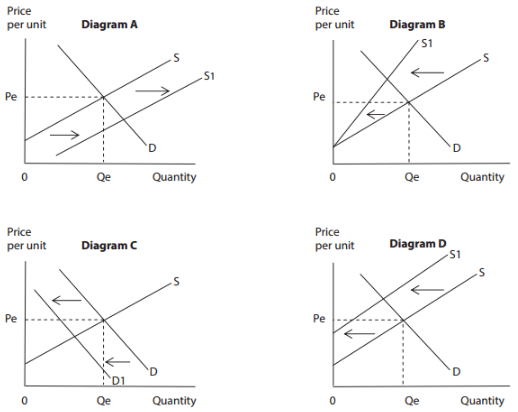
Which of the diagrams, labelled A, B, C and D, best illustrates the effects of an increase in VAT?
Statement 1: In the UK, a 50% tax rate applies on taxable earnings over £150 000 a year.
AND
Statement 2: The 50% tax rate is unfair to high income earners since it reduces their living standards.
Which of the following best describes the two statements above?
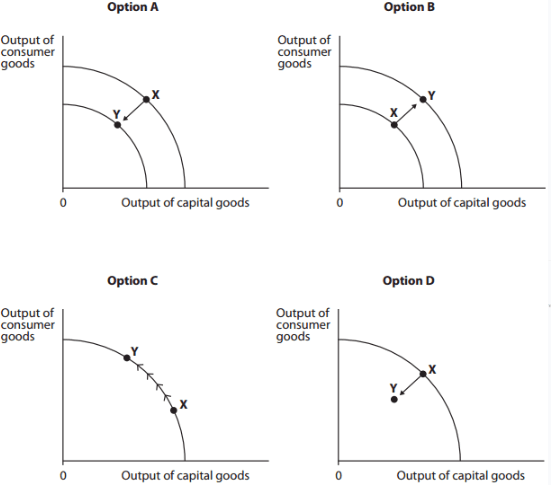
In which of the above diagrams does the movement from X to Y illustrate economic growth?
Assuming the current price is P1 , the mostly likely outcome is
It may be deduced from the data in the table that
It can be deduced from the diagram that these two goods
Which of the following is most likely to have a high price elasticity of supply?
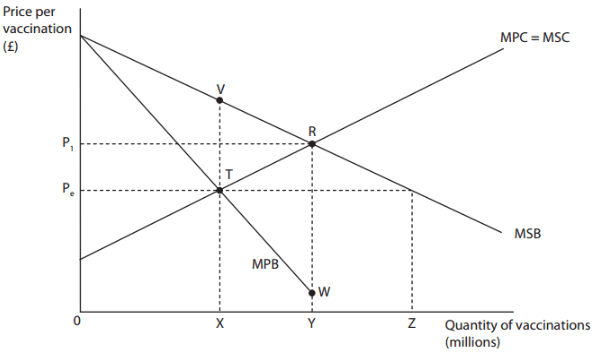
The diagram shows a free market for vaccinations in which the current equilibrium level of output is X and price Pe. At this level of output there is