Loading...
Assessment: Graphs
Quiz by Herminia Joy Artes
Track each student's skills and progress in your Mastery dashboards
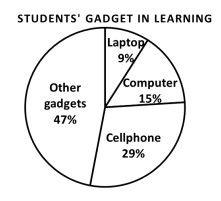
Refer to the circle graph below:
How many percent of students used laptop or computer in learning?

24%
9%
29%
15%
How many students used cellphone if there are 500 students in the school?

75
235
45
145
Refer to the circle graph below:
How many percent of students used laptop or computer in learning?
How many students used cellphone if there are 500 students in the school?

Refer to the line graph below:
What kind of graph is being presented?
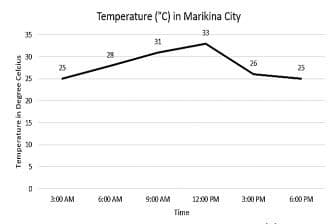
What is the coldest temperature presented in the line graph?

At what time is the hottest temperature recorded?
