

Bar graph - Worksheet
Quiz by Shanil Mohamed
Feel free to use or edit a copy
includes Teacher and Student dashboards
Measure skillsfrom any curriculum
Measure skills
from any curriculum
Tag the questions with any skills you have. Your dashboard will track each student's mastery of each skill.
With a free account, teachers can
- edit the questions
- save a copy for later
- start a class game
- automatically assign follow-up activities based on students’ scores
- assign as homework
- share a link with colleagues
- print as a bubble sheet
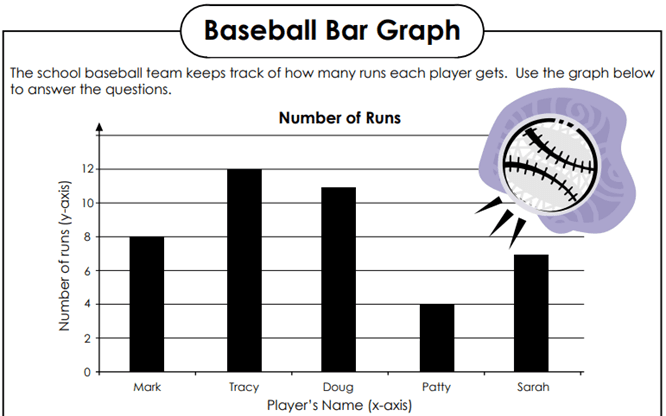
- Q 1/16Score 0How many runs did Sarah have?298674


16 questions
Show answers
- Q1How many runs did Sarah have?867430s
- Q2How many fewer runs did Mark have than Tracy?348030s
- Q3How many runs did the player with most runs have?7128430s
- Q4How many more runs did Doug have than Sarah?234030s
- Q5How many more runs did Tracy have than Patty?4123830s
- Q6Which type of TV set is more popular?DEAB45s
- Q7What information is given by the graph?TV sales in a week of different brandsBrandNumbersTV Sold30s
- Q8How many TV sets were sold in the whole week?4010012012545s
- Q9How many TV sets did Brand A sold1020403045s
- Q10Which brand of TV sets had minimum sale?CABE30s
- Q11How many pounds of newspapers did Mrs Tobia's class recycle?280300260270120s
- Q12How many pounds of newspapers did Mr Herschal's class recycle?280310270300120s
- Q13Numbers on the scale are counting by10203040120s
- Q14How many pounds did Ms Franklin's class recycle than Miss Renata?32012020014060s
- Q15Horizontal lines in the graph shows increment of30402010120s


