Loading...

Bell Ringer Quiz 2 (Unit2 Week3) – TEKS 7.7C: Interpreting Motion from Graphs
Quiz by Grade 7 Science - Texas Education Agency
Track each student's skills and progress in your Mastery dashboards
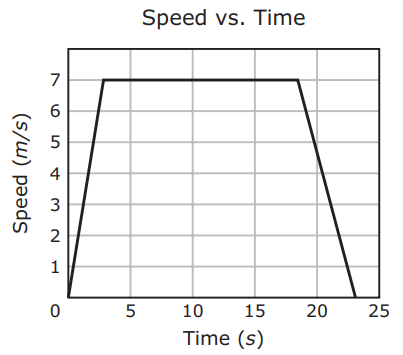
The speed of an object over time is shown in the graph.
Which table describes the object’s motion?


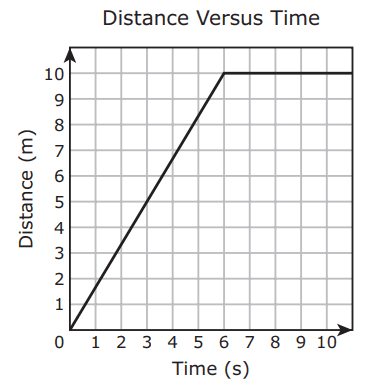
The graph shows the distance an object traveled in 11 seconds.
Which answer choice best describes the movement of the object between the times of 0 and 6 seconds on the graph?

Moving at a constant speed
Accelerating
Moving toward the north
Stopped
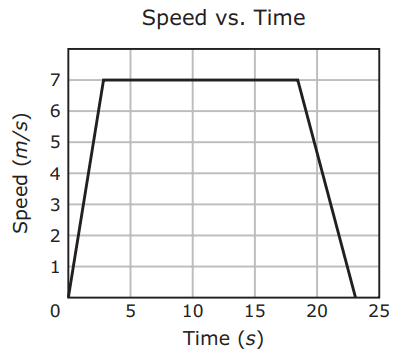
The speed of an object over time is shown in the graph.
Which table describes the object’s motion?
The graph shows the distance an object traveled in 11 seconds.
Which answer choice best describes the movement of the object between the times of 0 and 6 seconds on the graph?
A distance–time graph of a runner’s trip has three straight segments:
• 0–5 s: distance increases from 0m to 15m
• 5–8 s: distance stays at 1 m
• 8–12 s: distance increases from 15m to 39m
Which statement is correct?