Calculating theoretical probabilities from Venn diagrams (two events)
Quiz by Oak National Academy: KS3 Maths (2)
Feel free to use or edit a copy
includes Teacher and Student dashboards
Measure skillsfrom any curriculum
Measure skills
from any curriculum
Tag the questions with any skills you have. Your dashboard will track each student's mastery of each skill.
With a free account, teachers can
- edit the questions
- save a copy for later
- start a class game
- automatically assign follow-up activities based on students’ scores
- assign as homework
- share a link with colleagues
- print as a bubble sheet
6 questions
Show answers
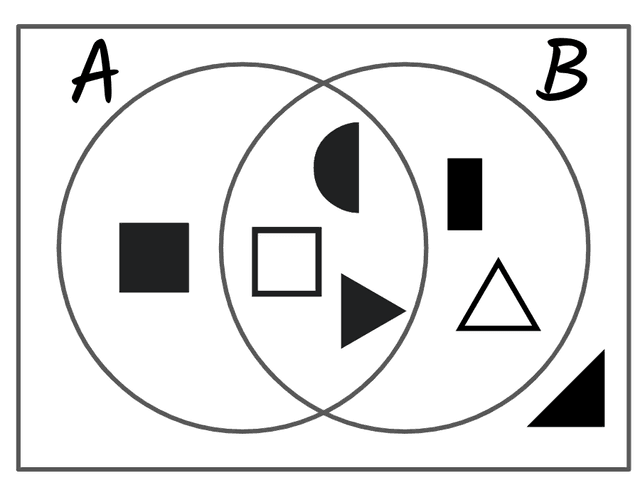
- Q1Using this Venn diagram, what is the probability of an object being randomly selected from B?30s
- Q2Using this Venn diagram, what is the probability of an object being randomly selected that is in A and B?30s
- Q3Using the diagram, what is P(A and not B)?30s
- Q4Using the diagram, what is P(not A and not B)?30s
- Q5Using the diagram, what is P(not A and not B)?30s
- Q6Using the diagram, what is P(A and B)?Users sort answers between categoriesSorting30s
