Tag the questions with any skills you have. Your dashboard will track each student's mastery of each skill.
Give this quiz to my class
Q 1/14
Score 0
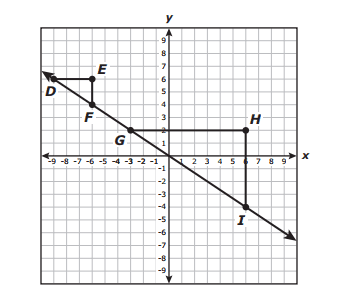
Triangle DEF and triangle GHI are similar right triangles. Based on this information, which statement is true?
30
The slope of the hypotenuse of triangle DEF is less than the slope of the hypotenuse of triangle GHI.
The slope of the hypotenuse of triangle DEF is greater than the slope of the hypotenuse of triangle GHI.
The slope of the hypotenuse of triangle DEF is equal to the slope of the hypotenuse of triangle GHI.
The relationship between the slope of the hypotenuse of triangle DEF and the slope of the hypotenuse of triangle GHI cannot be determined.
Q 2/14
Score 0
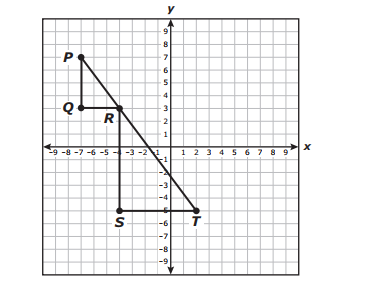
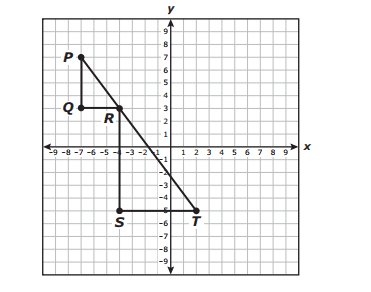
Triangles PQR and RST are similar right triangles.
30
#texas/0a0703f7-2fed-422f-9cfd-279d6b55bbd5/C.png
#texas/0a0703f7-2fed-422f-9cfd-279d6b55bbd5/D.png
#texas/0a0703f7-2fed-422f-9cfd-279d6b55bbd5/B.png
#texas/0a0703f7-2fed-422f-9cfd-279d6b55bbd5/A.png
14 questions
Q.
Triangle DEF and triangle GHI are similar right triangles. Based on this information, which statement is true?
1
30 sec
Q.
Triangles PQR and RST are similar right triangles.
2
30 sec
Q.
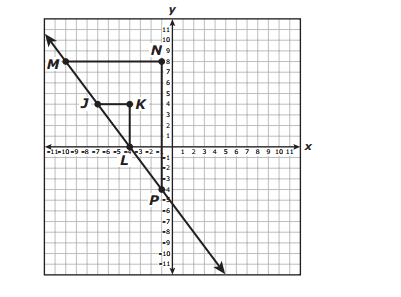
Triangle MNP and triangle JKL are similar right triangles. Which proportion can be used to show that the slope of JL is equal to the slope of MP
3
30 sec
Q.
Judy can decorate 3 cakes in 5 hours. Which graph has a slope that best represents the number of cakes per hour Judy can decorate?
4
30 sec
Q.
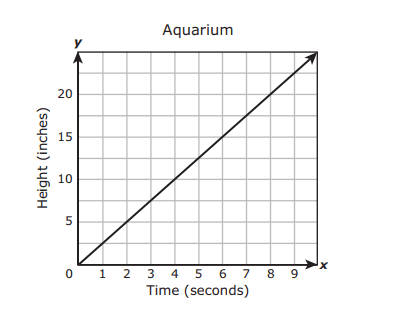
An aquarium is being filled with water. The graph shows the height of the water over time as the aquarium is being filled. Which statement best describes the rate of change for this situation?
5
30 sec
Q.
A tree in Dante’s neighborhood grew 18 inches in the first 2 years after it was planted. If the tree continues to grow at this same rate, which graph best represents the growth rate of the tree in inches per year?
6
30 sec
Q.
On a field trip, there are 3 adults for every 45 students. Which graph models a relationship with the same unit rate?
7
30 sec
Q.
A water hose discharges water at a rate of 45 gallons per minute. Which graph has a slope that best represents this rate?
8
30 sec
Q.
Leanor pays a total of $16.50 for every 6 shirts she has dry-cleaned. Which graph models a relationship with the same unit rate?
9
30 sec
Q.
The graph of a linear function is shown on the coordinate grid. What is the y-intercept of the graph of the linear function? Be sure to use the correct place value.
10
30 sec
Q.
What are the slope and the y-intercept of the graph of the linear function shown on the grid?
11
30 sec
Q.
The graph of a linear function is shown on the coordinate grid. What is the y-intercept of the graph of the linear function? Be sure to use the correct place value.
12
30 sec
Q.
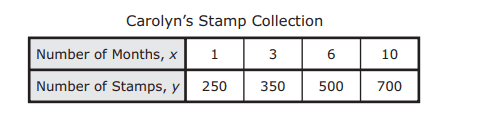
Carolyn will buy the same number of stamps every month to add to a stamp collection her grandfather gave her. The table shows the number of stamps Carolyn will have at the end of x months. How many stamps was Carolyn given, and how many stamps will she buy every month?
13
30 sec
Q.
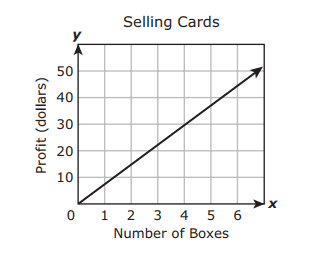
Emily sells greeting cards. The graph models the linear relationship between the number of boxes of cards she sells and her profit. Which of these best describes the profit Emily makes from selling these cards?