

Chart Reading Practice 1
Quiz by FATEMA HASAN ALI ALI
Feel free to use or edit a copy
includes Teacher and Student dashboards
Measure skillsfrom any curriculum
Measure skills
from any curriculum
Tag the questions with any skills you have. Your dashboard will track each student's mastery of each skill.
With a free account, teachers can
- edit the questions
- save a copy for later
- start a class game
- automatically assign follow-up activities based on students’ scores
- assign as homework
- share a link with colleagues
- print as a bubble sheet
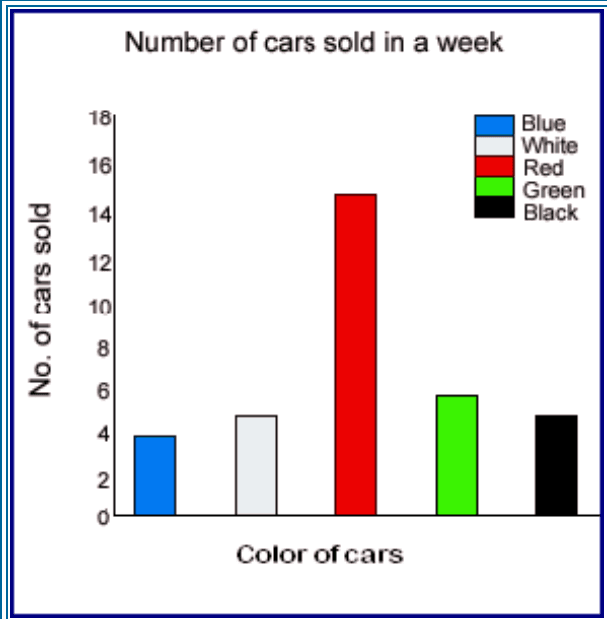
- Q 1/10Score 0Use the chart to answer the questions. The title of this graph is:29The color of carsThe number of cars soldThe number of cars sold in a week


10 questions
Show answers
- Q1Use the chart to answer the questions. The title of this graph is:The color of carsThe number of cars soldThe number of cars sold in a week30s
- Q2The horizontal axis shows:Color of carsNumber of cars sold in a weekNumber of cars sold30s
- Q3The vertical axis shows:color of carsNumber of cars sold in a weekNumber of cars sold30s
- Q4Which color of car sold the most?BlackWhiteRedGreen30s
- Q5How many blue cars were sold?6 Cars7 Cars4 Cars5 Cars30s
- Q6Which two colors of cars sold the same amount?black and whiteblue and whiteblack and bluewhite and green30s
- Q7There were six cars of this color sold.greenwhiteblackblue30s
- Q8How many red cars were sold?15 Cars18 Cars17 Cars12 Cars30s
- Q9What is the total number of black and white cars sold?10 Cars5 Cars2 Cars7 Cars30s
- Q10How many total cars (all colors) were sold in this week?20 Cars35 Cars18 Cars25 Cars30s


