
Class quiz 18: Ch.12 Presentation of Data (I)
Quiz by Ms Choi
Feel free to use or edit a copy
includes Teacher and Student dashboards
Measure skillsfrom any curriculum
Tag the questions with any skills you have. Your dashboard will track each student's mastery of each skill.
- edit the questions
- save a copy for later
- start a class game
- automatically assign follow-up activities based on students’ scores
- assign as homework
- share a link with colleagues
- print as a bubble sheet
- Q1The frequency distribution table shows the numbers of movies watched by a group of students last month. How many students are there in the group?166101360s
- Q2The frequency distribution table shows the daily numbers of students who were late for school last month. Find the number of days that at least 2 students were late for school last month.51271560s
- Q3List all the data in the stem-and-leaf diagram.0, 0, 0, 1, 1, 1, 10, 0, 1, 1, 10, 0, 0, 1, 11, 11, 110, 0, 1, 11, 1160s
- Q4The stem-and-leaf diagram shows the weights (in kg) of a group of adults. How many adults in the group are heavier than 50 kg?987660s
- Q5Which of the following are not discrete data?The thicknesses of books in a bookshelfThe number of live chickens imported into Hong Kong every dayThe number of model toys that each boy hasThe number of students wearing glasses in each class60s
- Q6
The statistical diagram below shows the numbers of customers and the incomes of a boutique from Monday to Friday. On which day was the incomethe highest?
Tuesday
Thursday
Friday
Wednesday
60s - Q7
Which kind of data are the following?
I. The distance achieved byeach athlete in a long jump competition
II. The numbers of participantsin 10 long jump competitions
I: discrete data II: continuous data
I: discrete data II: discrete data
I: continuous data II: discrete data
I: continuous data II: continuous data
60s - Q8
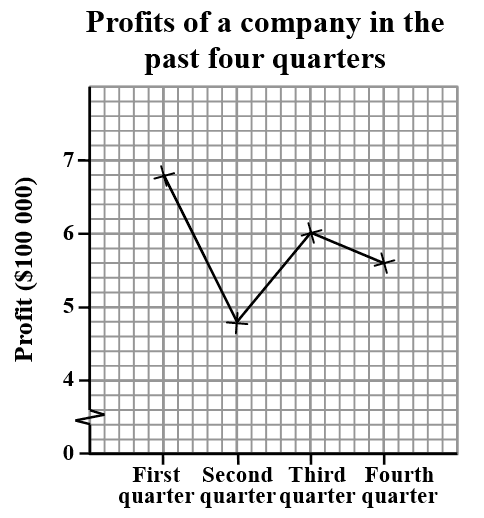
The broken line graph shows the profits ofa company in the past four quarters.
Find the total profit of the company in the four quarters.
$2320 000
$680000
$232000
$2 720 000
60s - Q9
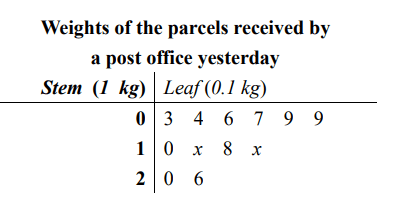
Thefollowing stem-and-leaf diagram shows the weights of the parcels received by apost office yesterday. How many of the parcels weighed 1.8 kg orless?
8
10
9
5
60s - Q10
The statistical diagram below shows the numbers of customers and theprofits of a shop from Monday to Friday in a week.
Which of the following is/aretrue?
I. When the number of customers decreased gradually, the profitdecreased gradually.
II. When the number of customers increased gradually, the profitincreased gradually.
I and II
None of the above
I only
II only
120s
