Loading...

CONTEMPORARY SCIENTIFIC AND TECHNOLOGICAL ADVANCES AND CHALLENGES (Personal Context))
Quiz by bandigan
Tag the questions with any skills you have. Your dashboard will track each student's mastery of each skill.
Context: (Genetic Disease)
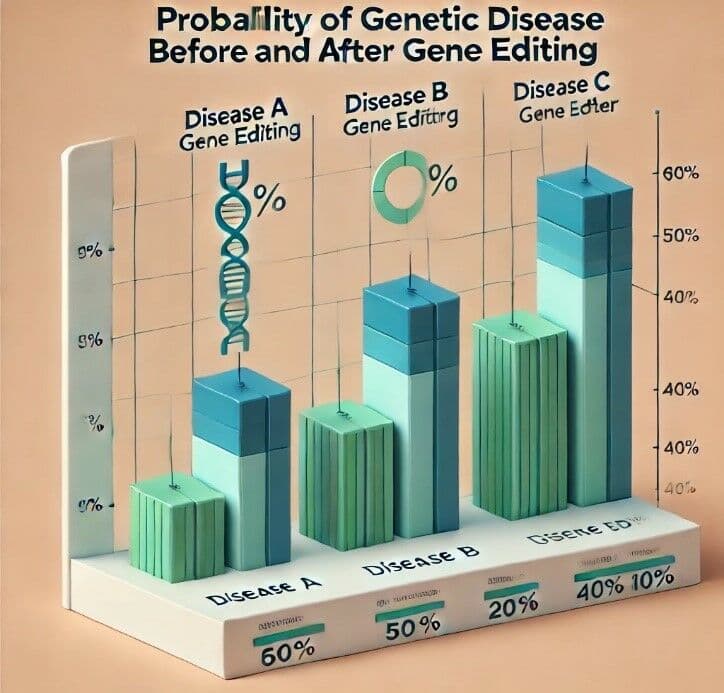
Imagine you have a loved one diagnosed with a genetic disorder, and you worry about how such conditions affect families over generations. Thanks to advancements in biotechnology, scientists have developed a groundbreaking gene-editing treatment that aims to reduce the risk of inherited diseases by precisely modifying affected genes. This technology has the potential to change lives by significantly lowering the probability of disease occurrence. To measure its effectiveness, researchers analyze data comparing the likelihood of developing genetic disorders before and after the treatment. The results are presented in a bar graph, visually illustrating the reduction in risk for different diseases.
Illustration Description:
A bar graph titled "Probability of Genetic Disease Before and After Gene Editing"
X-axis: Diseases – Disease A, Disease B, Disease C
Y-axis: Probability (%) from 0% to 100%
For each disease, there are two bars:
Blue bar: Probability before gene editing
Green bar: Probability after gene editing
Bar Values:
Disease A: Before = 60%, After = 30%
Disease B: Before = 50%, After = 20%
Disease C: Before = 40%, After = 10%
Question 1:
Which disease shows the greatest reduction in the probability of occurrence after gene editing?

Disease A
All reductions are equal
Disease B
Disease C
Context: (Genetic Disease)
Imagine you have a loved one diagnosed with a genetic disorder, and you worry about how such conditions affect families over generations. Thanks to advancements in biotechnology, scientists have developed a groundbreaking gene-editing treatment that aims to reduce the risk of inherited diseases by precisely modifying affected genes. This technology has the potential to change lives by significantly lowering the probability of disease occurrence. To measure its effectiveness, researchers analyze data comparing the likelihood of developing genetic disorders before and after the treatment. The results are presented in a bar graph, visually illustrating the reduction in risk for different diseases.
Illustration Description:
A bar graph titled "Probability of Genetic Disease Before and After Gene Editing"
X-axis: Diseases – Disease A, Disease B, Disease C
Y-axis: Probability (%) from 0% to 100%
For each disease, there are two bars:
Blue bar: Probability before gene editing
Green bar: Probability after gene editing
Bar Values:
Disease A: Before = 60%, After = 30%
Disease B: Before = 50%, After = 20%
Disease C: Before = 40%, After = 10%
Question 2:
What is the percentage decrease in the probability of Disease C after gene editing?

10%
30%
20%
75%
Context: (Genetic Disease)
Imagine you have a loved one diagnosed with a genetic disorder, and you worry about how such conditions affect families over generations. Thanks to advancements in biotechnology, scientists have developed a groundbreaking gene-editing treatment that aims to reduce the risk of inherited diseases by precisely modifying affected genes. This technology has the potential to change lives by significantly lowering the probability of disease occurrence. To measure its effectiveness, researchers analyze data comparing the likelihood of developing genetic disorders before and after the treatment. The results are presented in a bar graph, visually illustrating the reduction in risk for different diseases.
Illustration Description:
A bar graph titled "Probability of Genetic Disease Before and After Gene Editing"
X-axis: Diseases – Disease A, Disease B, Disease C
Y-axis: Probability (%) from 0% to 100%
For each disease, there are two bars:
Blue bar: Probability before gene editing
Green bar: Probability after gene editing
Bar Values:
Disease A: Before = 60%, After = 30%
Disease B: Before = 50%, After = 20%
Disease C: Before = 40%, After = 10%
Question 1:
Which disease shows the greatest reduction in the probability of occurrence after gene editing?

Context: (Genetic Disease)
Imagine you have a loved one diagnosed with a genetic disorder, and you worry about how such conditions affect families over generations. Thanks to advancements in biotechnology, scientists have developed a groundbreaking gene-editing treatment that aims to reduce the risk of inherited diseases by precisely modifying affected genes. This technology has the potential to change lives by significantly lowering the probability of disease occurrence. To measure its effectiveness, researchers analyze data comparing the likelihood of developing genetic disorders before and after the treatment. The results are presented in a bar graph, visually illustrating the reduction in risk for different diseases.
Illustration Description:
A bar graph titled "Probability of Genetic Disease Before and After Gene Editing"
X-axis: Diseases – Disease A, Disease B, Disease C
Y-axis: Probability (%) from 0% to 100%
For each disease, there are two bars:
Blue bar: Probability before gene editing
Green bar: Probability after gene editing
Bar Values:
Disease A: Before = 60%, After = 30%
Disease B: Before = 50%, After = 20%
Disease C: Before = 40%, After = 10%
Question 2:
What is the percentage decrease in the probability of Disease C after gene editing?
Context: (Genetic Disease)
Imagine you have a loved one diagnosed with a genetic disorder, and you worry about how such conditions affect families over generations. Thanks to advancements in biotechnology, scientists have developed a groundbreaking gene-editing treatment that aims to reduce the risk of inherited diseases by precisely modifying affected genes. This technology has the potential to change lives by significantly lowering the probability of disease occurrence. To measure its effectiveness, researchers analyze data comparing the likelihood of developing genetic disorders before and after the treatment. The results are presented in a bar graph, visually illustrating the reduction in risk for different diseases.
Illustration Description:
A bar graph titled "Probability of Genetic Disease Before and After Gene Editing"
X-axis: Diseases – Disease A, Disease B, Disease C
Y-axis: Probability (%) from 0% to 100%
For each disease, there are two bars:
Blue bar: Probability before gene editing
Green bar: Probability after gene editing
Bar Values:
Disease A: Before = 60%, After = 30%
Disease B: Before = 50%, After = 20%
Disease C: Before = 40%, After = 10%
Question 3:
Why is using a bar graph helpful to represent the effectiveness of gene editing?
Context: ( EFFECT OF GENE- EDITING)
Picture a world where scientists have developed a new gene-editing technique that could change the future of medicine. This technique is designed to reduce the risk of a serious genetic disorder by precisely modifying the affected genes before symptoms appear. To test its effectiveness, researchers conducted a scientific experiment using two groups of 100 people each:
Experimental Group: Received the gene-editing treatment.
Control Group: Did not receive the treatment.
After a set period, scientists recorded the number of individuals in both groups who developed the disorder. The results were displayed in a bar graph, visually comparing how many people were affected in each group.
Illustration Description:
A double bar graph titled "Effect of Gene Editing on Disorder Development"
X-axis: Two groups – Control Group and Experimental Group
Y-axis: Number of people (0 to 100)
Two bars for each group:
Red bar: Number of people who developed the disorder
Green bar: Number of people who did not develop the disorder
Bar Values:
Control Group: 60 developed the disorder, 40 did not
Experimental Group: 20 developed the disorder, 80 did not
Question 1:
Based on the graph, what is the percentage of people who developed the disorder in the Control Group?

Context: ( EFFECT OF GENE- EDITING)
Picture a world where scientists have developed a new gene-editing technique that could change the future of medicine. This technique is designed to reduce the risk of a serious genetic disorder by precisely modifying the affected genes before symptoms appear. To test its effectiveness, researchers conducted a scientific experiment using two groups of 100 people each:
Experimental Group: Received the gene-editing treatment.
Control Group: Did not receive the treatment.
After a set period, scientists recorded the number of individuals in both groups who developed the disorder. The results were displayed in a bar graph, visually comparing how many people were affected in each group.
Illustration Description:
A double bar graph titled "Effect of Gene Editing on Disorder Development"
X-axis: Two groups – Control Group and Experimental Group
Y-axis: Number of people (0 to 100)
Two bars for each group:
Red bar: Number of people who developed the disorder
Green bar: Number of people who did not develop the disorder
Bar Values:
Control Group: 60 developed the disorder, 40 did not
Experimental Group: 20 developed the disorder, 80 did not
Question 2:
What is the reduction in the number of people who developed the disorder after gene editing compared to the control group?
Context: (EFFECT OF GENE- EDITING)
Picture a world where scientists have developed a new gene-editing technique that could change the future of medicine. This technique is designed to reduce the risk of a serious genetic disorder by precisely modifying the affected genes before symptoms appear. To test its effectiveness, researchers conducted a scientific experiment using two groups of 100 people each:
Experimental Group: Received the gene-editing treatment.
Control Group: Did not receive the treatment.
After a set period, scientists recorded the number of individuals in both groups who developed the disorder. The results were displayed in a bar graph, visually comparing how many people were affected in each group.
Illustration Description:
A double bar graph titled "Effect of Gene Editing on Disorder Development"
X-axis: Two groups – Control Group and Experimental Group
Y-axis: Number of people (0 to 100)
Two bars for each group:
Red bar: Number of people who developed the disorder
Green bar: Number of people who did not develop the disorder
Bar Values:
Control Group: 60 developed the disorder, 40 did not
Experimental Group: 20 developed the disorder, 80 did not
Question 3:
Why did the scientists include both a Control Group and an Experimental Group in their study?
Context: ( GENETIC DISORDER)
Suppose your family is faced with an important medical decision. A new gene-editing technology has been developed to reduce the risk of an inherited genetic disorder, offering hope to many families with a history of such conditions. Before making a decision, your family carefully researches the results of clinical trials to understand how effective the procedure is for different age groups.
Scientists have conducted extensive trials to measure the success rate of gene editing across various age groups. The results are displayed in a graph, showing how age affects the effectiveness of the procedure. Since younger cells may respond differently to genetic modifications than older ones, analyzing this data is crucial for making an informed choice about treatment.
Illustration Description:
A line graph titled "Success Rate of Gene Editing by Age Group"
X-axis: Age groups (0–10, 11–20, 21–30, 31–40, 41–50)
Y-axis: Success rate (%) from 0% to 100%
The graph shows a downward trend as age increases:
0–10 years: 95% success
11–20 years: 90% success
21–30 years: 80% success
31–40 years: 65% success
41–50 years: 50% success
Question 1:
According to the graph, which age group has the highest success rate for gene editing?
Context: (GENETIC DISORDER)
Suppose your family is faced with an important medical decision. A new gene-editing technology has been developed to reduce the risk of an inherited genetic disorder, offering hope to many families with a history of such conditions. Before making a decision, your family carefully researches the results of clinical trials to understand how effective the procedure is for different age groups.
Scientists have conducted extensive trials to measure the success rate of gene editing across various age groups. The results are displayed in a graph, showing how age affects the effectiveness of the procedure. Since younger cells may respond differently to genetic modifications than older ones, analyzing this data is crucial for making an informed choice about treatment.
Illustration Description:
A line graph titled "Success Rate of Gene Editing by Age Group"
X-axis: Age groups (0–10, 11–20, 21–30, 31–40, 41–50)
Y-axis: Success rate (%) from 0% to 100%
The graph shows a downward trend as age increases:
0–10 years: 95% success
11–20 years: 90% success
21–30 years: 80% success
31–40 years: 65% success
41–50 years: 50% success
Question 2:
What is the difference in success rate between the age groups 21–30 and 41–50?
Context: (GENETIC DISORDER)
Suppose your family is faced with an important medical decision. A new gene-editing technology has been developed to reduce the risk of an inherited genetic disorder, offering hope to many families with a history of such conditions. Before making a decision, your family carefully researches the results of clinical trials to understand how effective the procedure is for different age groups.
Scientists have conducted extensive trials to measure the success rate of gene editing across various age groups. The results are displayed in a graph, showing how age affects the effectiveness of the procedure. Since younger cells may respond differently to genetic modifications than older ones, analyzing this data is crucial for making an informed choice about treatment.
Illustration Description:
A line graph titled "Success Rate of Gene Editing by Age Group"
X-axis: Age groups (0–10, 11–20, 21–30, 31–40, 41–50)
Y-axis: Success rate (%) from 0% to 100%
The graph shows a downward trend as age increases:
0–10 years: 95% success
11–20 years: 90% success
21–30 years: 80% success
31–40 years: 65% success
41–50 years: 50% success
Question 3:
If a family is deciding whether to use gene editing for their 12-year-old child, why would this graph be helpful?
Context: (VIRTUAL REALITY)
Envision yourself are part of a school experiment exploring how new technology can improve learning. Scientists and educators are investigating whether Virtual Reality (VR) can make math lessons more engaging and effective compared to traditional classroom teaching. VR allows students to interact with 3D mathematical concepts, visualize complex problems, and engage in immersive learning experiences.
To test its effectiveness, your school conducted a scientific study with two groups of 50 students:
• VR Learning Group: Students used Virtual Reality technology to study mathematics, interacting with numbers and geometric shapes in a simulated 3D environment.
• Traditional Learning Group: Students learned math through regular classroom instruction, using textbooks and whiteboard explanations.
After one month, both groups took the same standardized math test. Their average scores were recorded and displayed in a graph to compare the effectiveness of each learning method.
Illustration Description:
A bar graph titled "Average Math Test Scores: VR Learning vs. Traditional Learning"
X-axis: Two groups – VR Group and Traditional Group
Y-axis: Average Test Score (0 to 100)
Bar Values:
VR Group: 85
Traditional Group: 70
Question1:
What is the percentage increase in the average score of the VR Group compared to the Traditional Group?