placeholder image to represent content

CR Prac. - Key Features of Linear Functions (A.3C)

Quiz by Valary Patterson

High School
Mathematics
Texas Essential Knowledge and Skills (TEKS)

Our brand new solo games combine with your quiz, on the same screen

Correct quiz answers unlock more play!

New Quizalize solo game modes
10 questions
Show answers
  • Q1

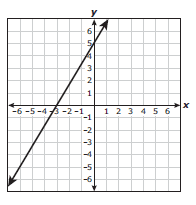
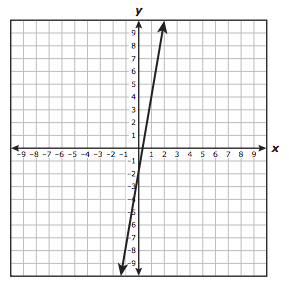
    What is the y-intercept of the line graphed on the grid?

    Question Image
    Users enter free text
    Type an Answer
    120s
    A.3.C: Graph Linear Functions
  • Q2

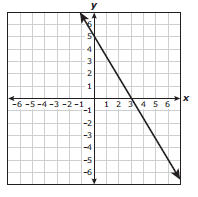
    Which graph represents -3x + 5y = - 15?

    Answer Image
    Answer Image
    Answer Image
    Answer Image
    300s
    A.3.C: Graph Linear Functions
  • Q3

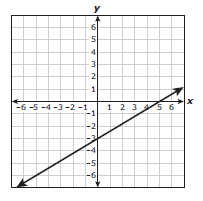
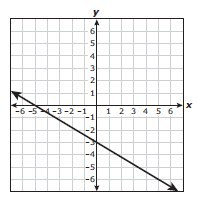
    Which graph shows a line with an x-intercept of -5?

    Answer Image
    Answer Image
    Answer Image
    Answer Image
    120s
    A.3.C: Graph Linear Functions
  • Q4

    A lifeguard earns $320 per week for working 40 hours plus $12 per hour worked over 40 hours. A lifeguard can work a maximum of 60 hours per week. Which graph best represents the lifeguard’s weekly earnings in dollars for working h hours over 40?

    Answer Image
    Answer Image
    Answer Image
    Answer Image
    120s
    A.3.C: Graph Linear Functions
  • Q5

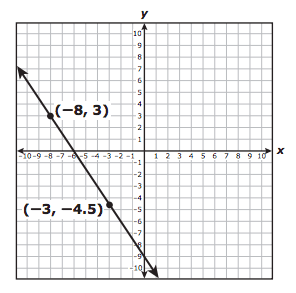
    The graph of a function is shown on the grid. Which ordered pair best represents the location of the y-intercept?

    Question Image

    (0, \frac{1}{3})

    (0, -2)

    (-2, 0)

    (\frac{1}{3},0)

    120s
    A.3.C: Graph Linear Functions
  • Q6

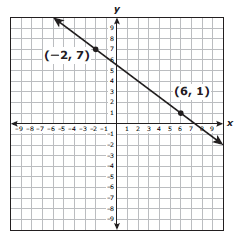
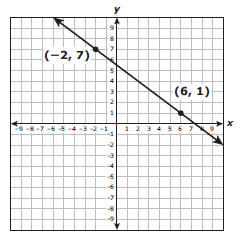
    The graph of linear function g is shown on the grid. What is the zero of g?

    Question Image
    Users enter free text
    Type an Answer
    120s
    A.3.C: Graph Linear Functions
  • Q7

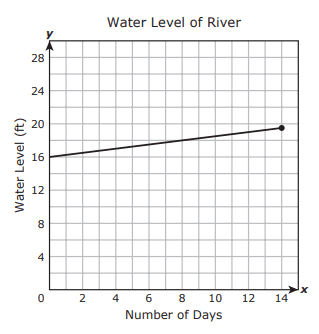
    The water level of a river was measured each day during a two-week period. The graph models the linear relationship between the water level of the river in feet and the number of days the water level was measured. Which statement best describes the y-intercept of the graph?

    Question Image

    The water level increased by 0.25 ft per day.

    The maximum water level was 19.5 ft.

    The water level was measured for 14 days.

    The initial water level was 16 ft.

    120s
    A.3.C: Graph Linear Functions
  • Q8
    Question Image
    Users enter free text
    Type an Answer
    300s
    A.3.C: Graph Linear Functions
  • Q9
    Answer Image
    Answer Image
    Answer Image
    Answer Image
    120s
    A.3.C: Graph Linear Functions
  • Q10
    300s
    A.3.C: Graph Linear Functions

Teachers give this quiz to your class