Describing charts
Quiz by Icy Heart
Feel free to use or edit a copy
includes Teacher and Student dashboards
Measure skillsfrom any curriculum
Measure skills
from any curriculum
Tag the questions with any skills you have. Your dashboard will track each student's mastery of each skill.
With a free account, teachers can
- edit the questions
- save a copy for later
- start a class game
- automatically assign follow-up activities based on students’ scores
- assign as homework
- share a link with colleagues
- print as a bubble sheet
5 questions
Show answers
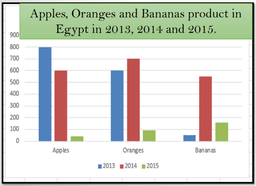
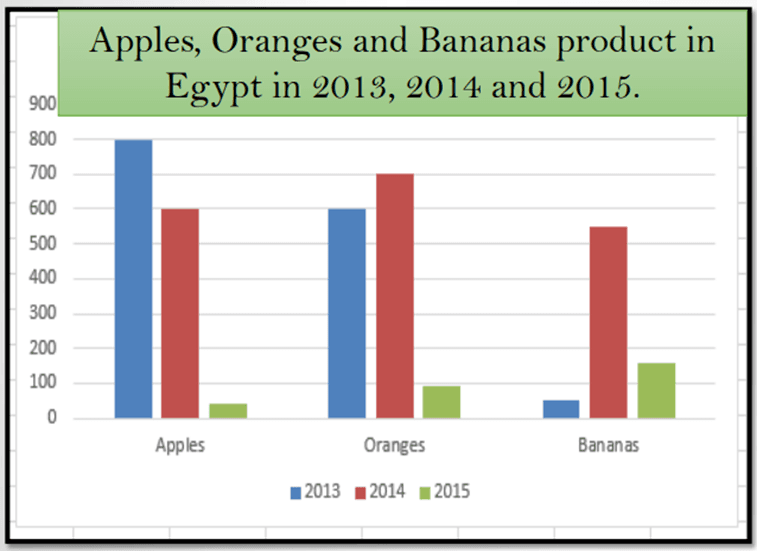
- Q1This chart shows the ........production of some fruits in Egypt between 2013 and 2015number of Apples and Bananas products only in Egypt in 2013,2014 and 2015.production of some vegetables in Egypt between 2013 and 2015number of Apples, Bananas and Oranges products in Egypt in 2013 and and 2015 only.30s
- Q2In 2013, the number of Apples .....didn't change.was stable.was the lowest.was the highest.30s
- Q3The production of Oranges was ...... in 2013.20070060010030s
- Q4Bananas production was very ......... in 2013.lowfattallhigh30s
- Q5Overall, the production of the fruits was ......... over the 3 years.stabledifferentdidn't changethe same30s
