Distance Time Graphs Quiz 3
Quiz by Trina Boyle
Feel free to use or edit a copy
includes Teacher and Student dashboards
Measure skillsfrom any curriculum
Measure skills
from any curriculum
Tag the questions with any skills you have. Your dashboard will track each student's mastery of each skill.
With a free account, teachers can
- edit the questions
- save a copy for later
- start a class game
- automatically assign follow-up activities based on students’ scores
- assign as homework
- share a link with colleagues
- print as a bubble sheet
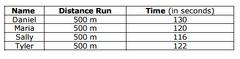
- Q 1/12Score 0Which student ran the fastest?29SallyDanielTyler


12 questions
Show answers
- Q1Which student ran the fastest?SallyDanielTyler60s
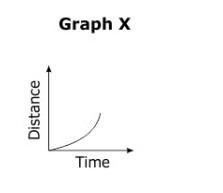
- Q2Speeding up or slowing down?speeding upslowing down30s
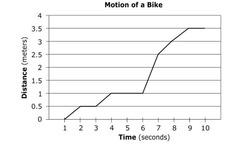
- Q3When did the bike stop?between 7 and 9 secondsbetween 1 and 2 secondsbetween 4 and 6 seconds30s
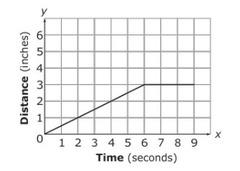
- Q4Describe the motion shown on the graph.constant speed then stopsgetting fasterstoppingstops then constant speed30s
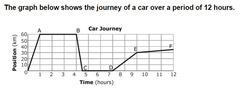
- Q5Which segment shows the car's slowest constant speed?EFABDE30s
- Q6Who won?JoshMandy30s
- Q7Describe the girls' motion.Lisa slows down; Crystal slows downCrystal slows down; Lisa speeds upLisa slows down; Crystal speeds up30s
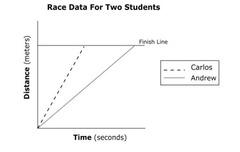
- Q8Who won?CarlosAndrew30s
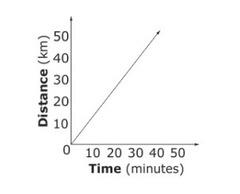
- Q9Describe the motion.no movementconstant distanceconstant speed30s
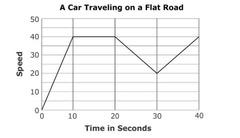
- Q10Between which seconds is the car traveling the fastest?0 to 1010 to 2020 to 4030s
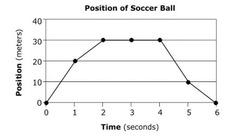
- Q11Describe the motion.The ball traveled 40 meters and then stoppedThe ball traveled 30 meters, stopped, and returned to its starting point.The ball traveled 30 meters then returned to the starting point.120s
- Q12Describe the motion.Both cars are moving at a constant speedCar 2 moved at a constant speed, while Car 1 stopped moving for 10 minutes.Car 1 moved at a constant speed, while Car 2 stopped moving for 10 minutes.30s