

Distance-Time Graphs
Quiz by Jennifer Pendleton
Feel free to use or edit a copy
includes Teacher and Student dashboards
Measure skillsfrom any curriculum
Measure skills
from any curriculum
Tag the questions with any skills you have. Your dashboard will track each student's mastery of each skill.
With a free account, teachers can
- edit the questions
- save a copy for later
- start a class game
- automatically assign follow-up activities based on students’ scores
- assign as homework
- share a link with colleagues
- print as a bubble sheet
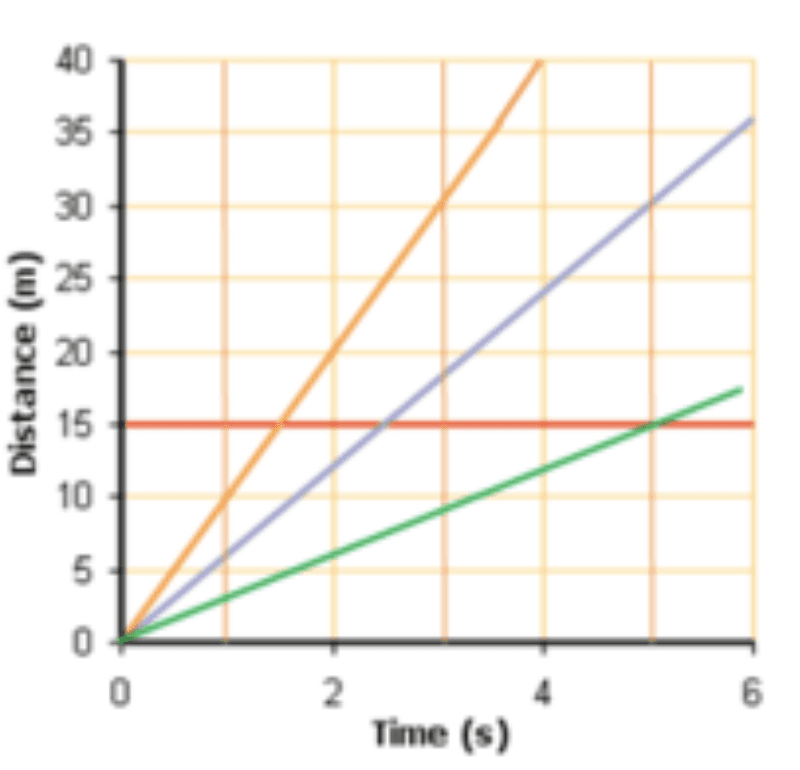
- Q 1/20Score 0Which line shows a slow, constant speed?29
blue
orange
red
green


20 questions
Show answers
- Q1Which line shows a slow, constant speed?
blue
orange
red
green30s - Q2Which line has a speed that is half of the speed of another line?
blue
orange
greenred
30s - Q3Which object is moving forward at a slower speed?
Object B
Object CObject A
30s - Q4How can you tell which line indicates a faster speed?
The line does not tell you this. You need to use the formula.
the greater the slope, the slower the speed
the longer the line, the greater the speed
the greater the slope, the faster the speed30s - Q5Which runner rested during the race?
Bob
Charlienone of them
Albert
30s - Q6On a distance time graph, what does a straight diagonal line indicate about the object's speed?
accelerating
constanttoo fast
at rest
30s - Q7Which line segment in the graph shows the object is not moving?B-C
A-D
C-D
A-B
30s - Q8What is happening from 5 to 15 seconds?
Going in a Straight Line
Constant Speed moving Forward
Standing StillConstant Speed moving Backwards
30s - Q9Which graph shows both runners starting at 10 ms?30s
- Q10Which line is the fastest?
both have the same speed
Red
Green30s - Q11What is happening from 0 to 5 seconds?
Standing Still
Constant Speed Moving Backward
Speeding Up
Constant Speed Moving Forward30s - Q12What is happening from 15 to 30 seconds?
Going Down a Hill
Constant Speed Moving Forward
Slowing Down
Constant Speed Moving Backward30s - Q13Which line shows the fastest speed?
green
blue
orangered
30s - Q14At which point is the object returning home?
A
EB
F
C
D
30s - Q15What does this graph represent?
Constant Speed
Standing Still (at rest)
Slowing Down
Speeding Up30s


